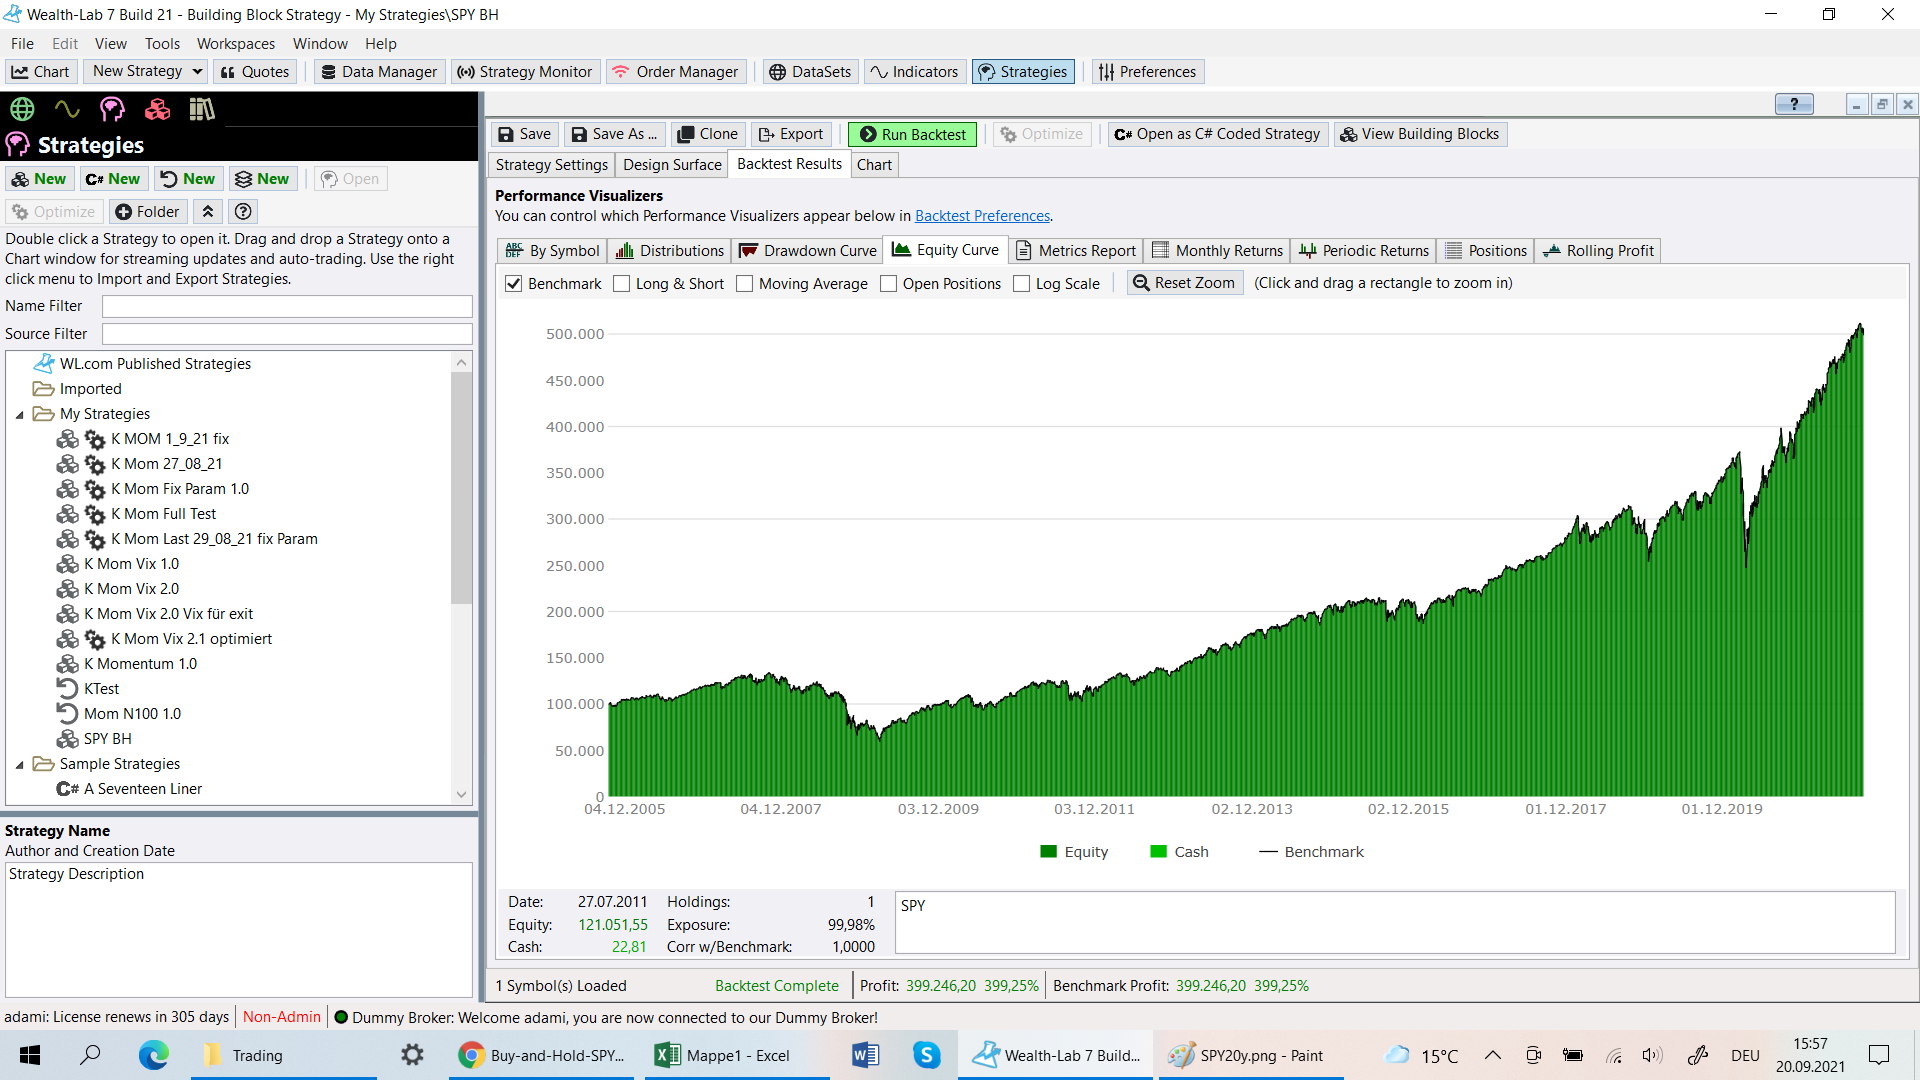
I just buy and hold SPY for 20 years.
The benchmark is also SPY.
They differ? How come?
Thanks and
br
ka
P.S.: Ich have the docu in a wordfile; how can I send it?
The benchmark is also SPY.
They differ? How come?
Thanks and
br
ka
P.S.: Ich have the docu in a wordfile; how can I send it?
Rename
They will ask you to describe and illustrate the difference)
What code are you using i.e. what's the StartIndex and on what bar does your trading start?
You should attach images as PNG when replying, no need in clumsy DOC/PDF please.
You should attach images as PNG when replying, no need in clumsy DOC/PDF please.
If you want your Buy & Hold Strategy to match the benchmark exactly set StartIndex to 1. The reason is that bar 0 is used to examine the closing price to determine the amount of shares to puchase SPY on bar 1. Setting StartIndex to 1 tells the benchmark backtest to use the same logic.
CODE:

using WealthLab.Backtest;
using WealthLab.Core;

namespace WealthScript1
{
    public class MyStrategy : UserStrategyBase
    {
        //Initialize
        public override void Initialize(BarHistory bars)
        {
         StartIndex = 1;
        }

        //Execute
        public override void Execute(BarHistory bars, int idx)
        {
         PlaceTrade(bars, TransactionType.Buy, OrderType.Market);
        }
    }
}
Oh, and what's with the comment, Replicant? Are you trying to insinuate that we don't answer questions here and instead try to obfuscate things??
QUOTE:
Oh, and what's with the comment, Replicant? Are you trying to insinuate that we don't answer questions here and instead try to obfuscate things??
No, I'm trying to insinuate that I got familiar with your question answering scripts)). You ask for more details first). And that's fair.
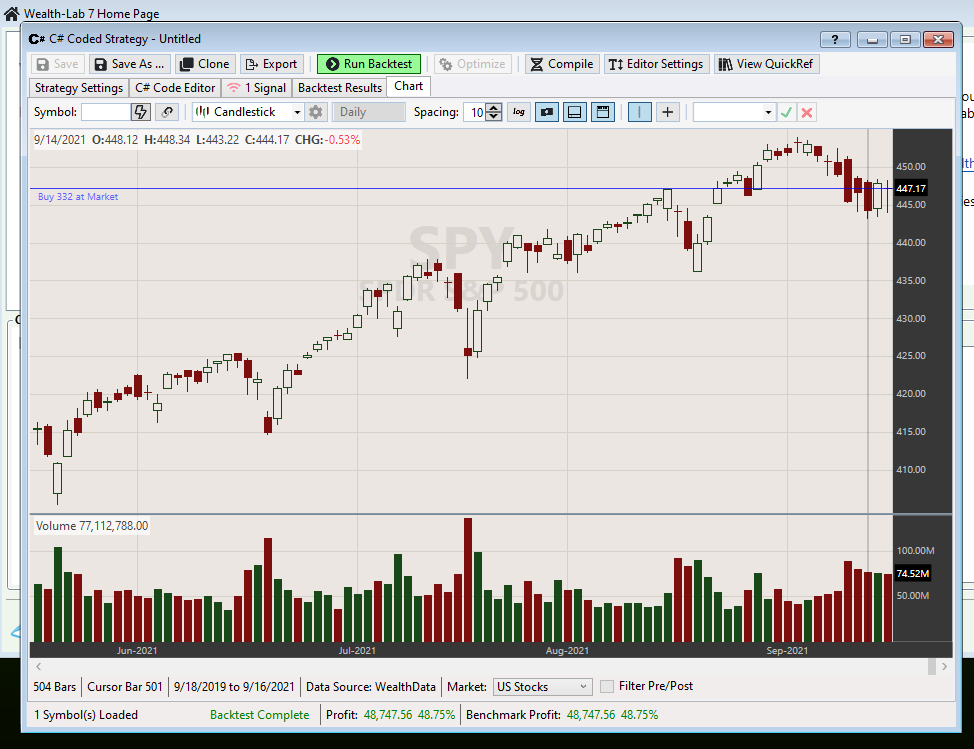
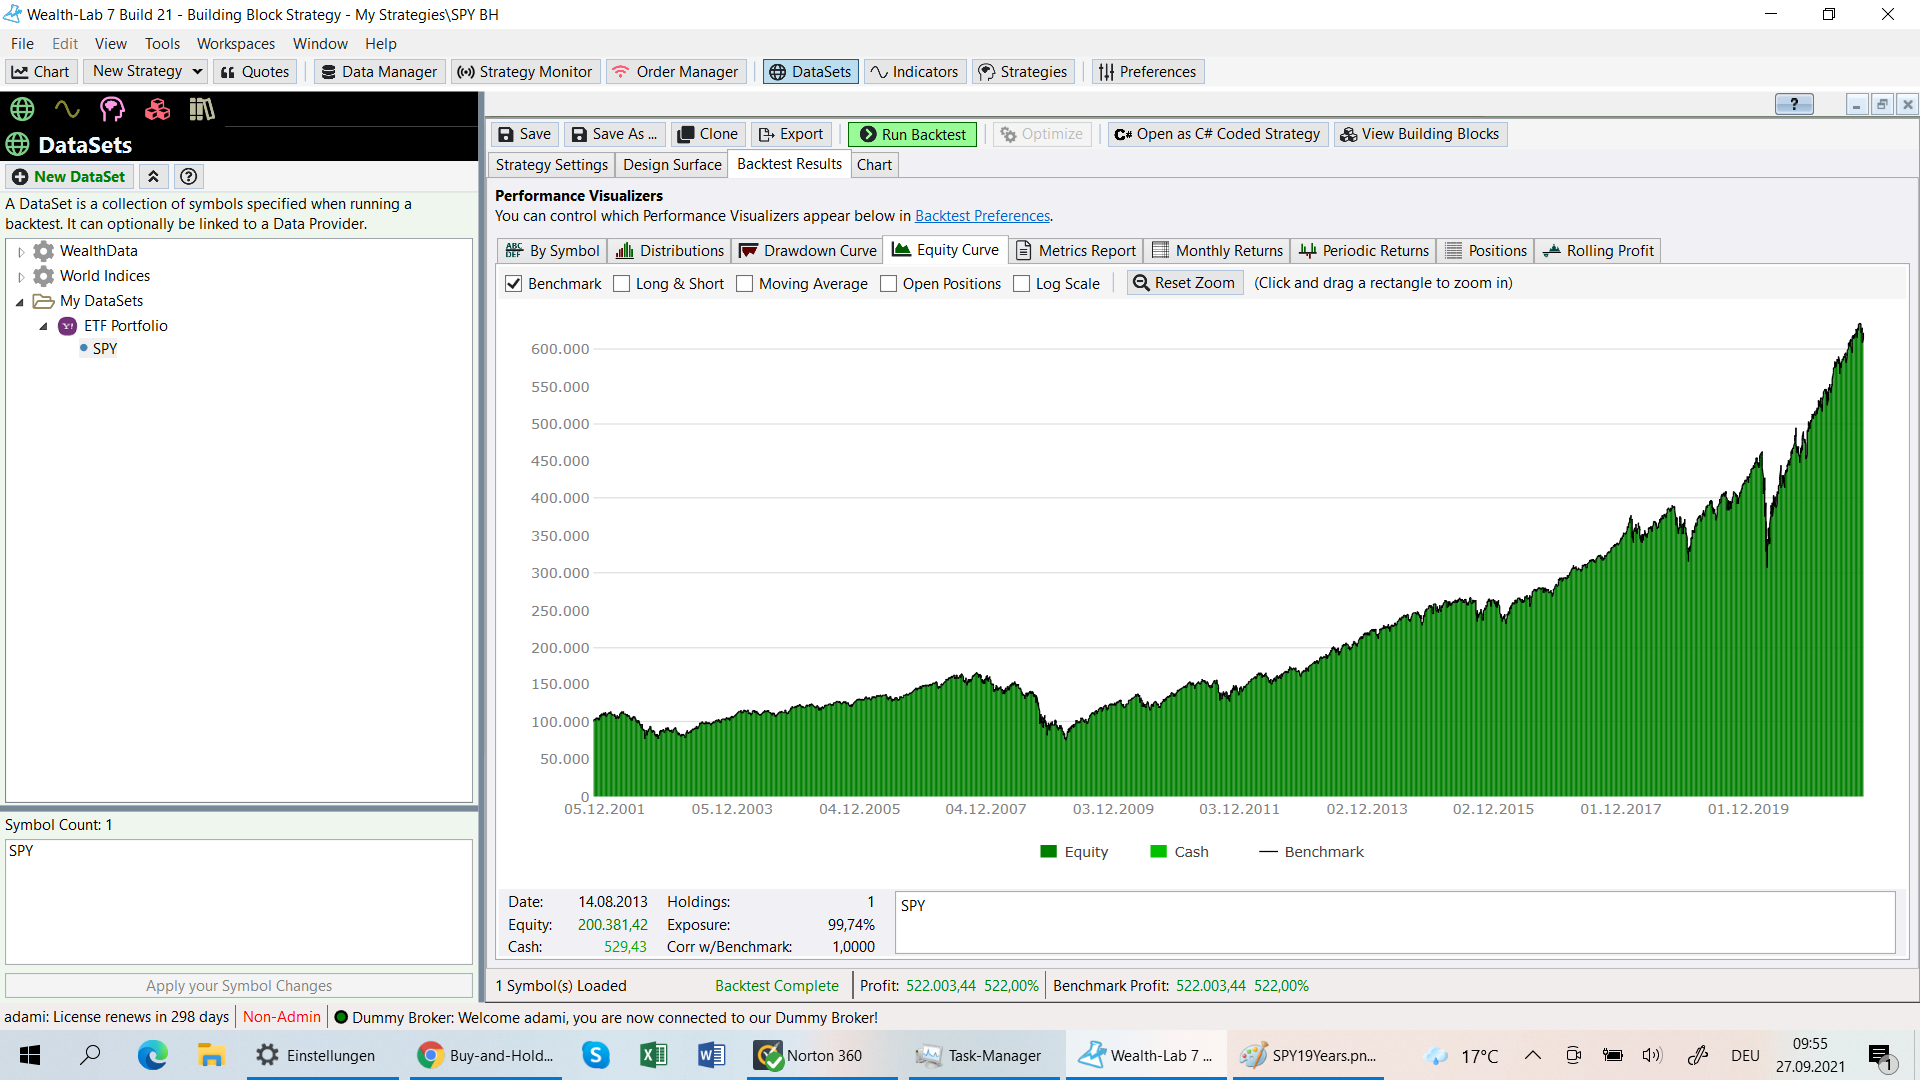
I use the full history of SPY from Yahoo and use building blocks with just buy market.
The difference after 20 years is quite big, as you see in the chart?
br
ka
check your metrics report for dividends
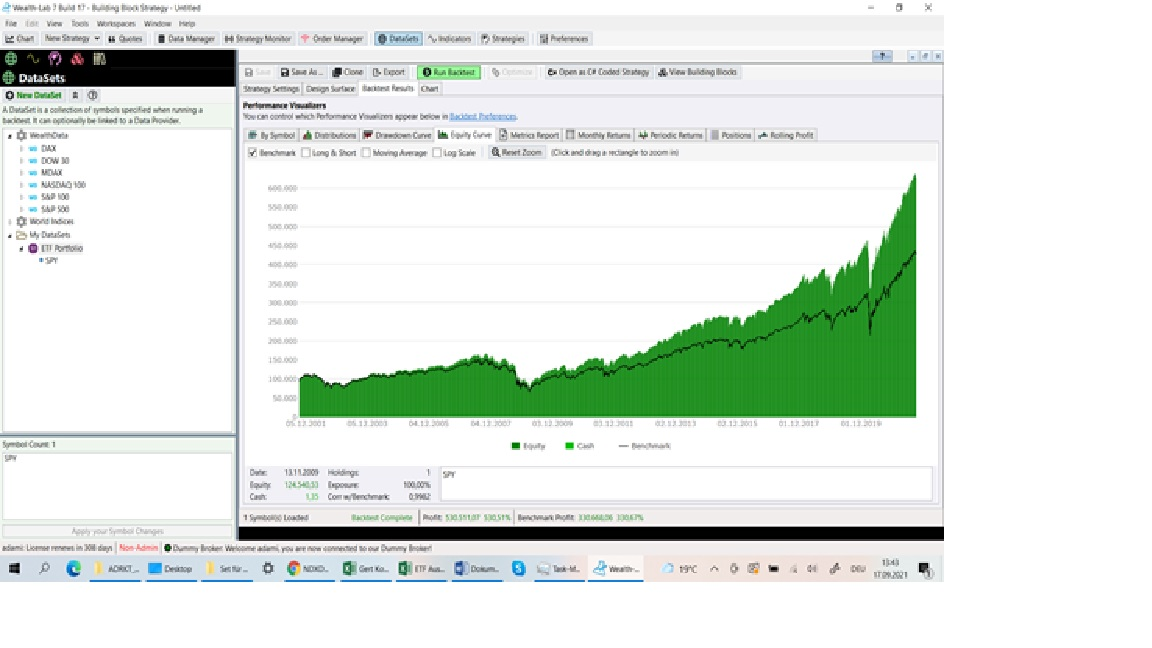
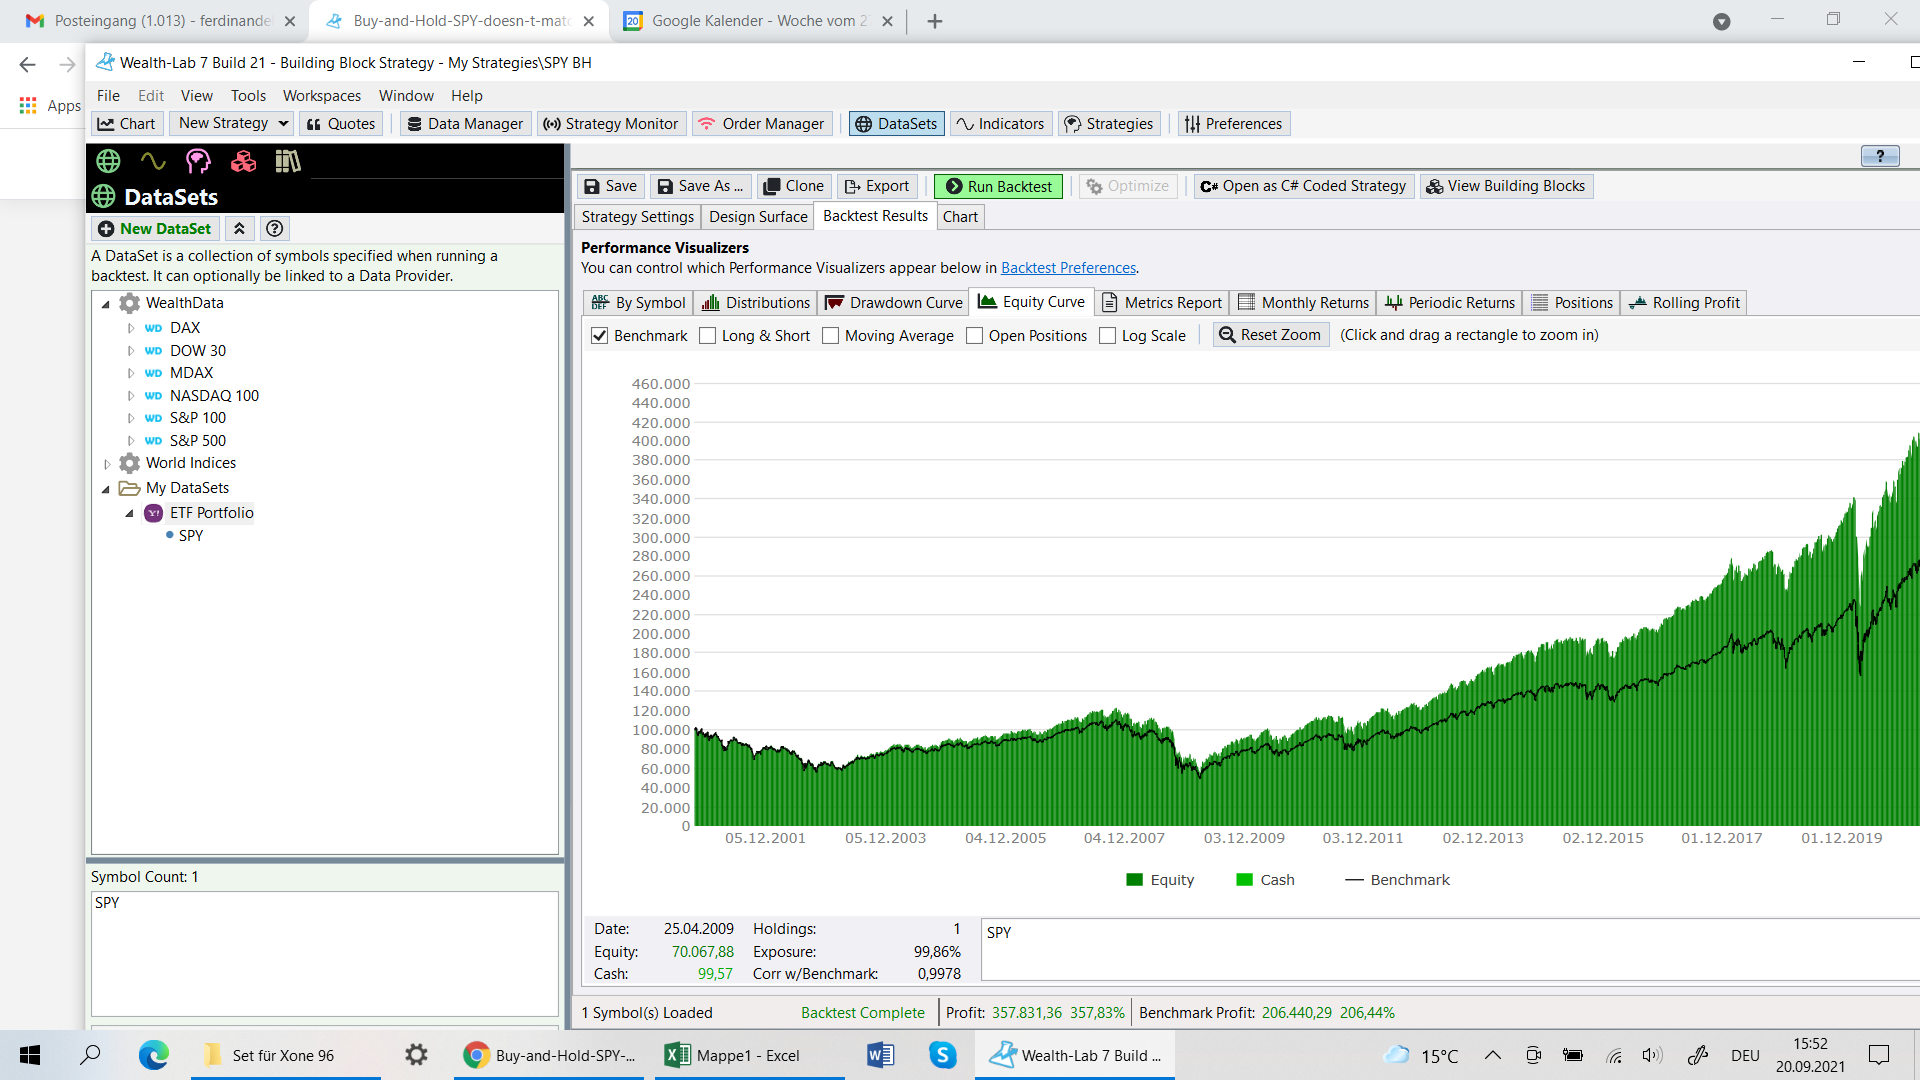
That's a good point that I personally never considered. Buy & Hold should always include dividends, but it does not - not even if Dividends are enabled to be collected for the backtest.
Nonetheless, the image above does not show dividends being collected because the light green cash level is constant.
Nonetheless, the image above does not show dividends being collected because the light green cash level is constant.
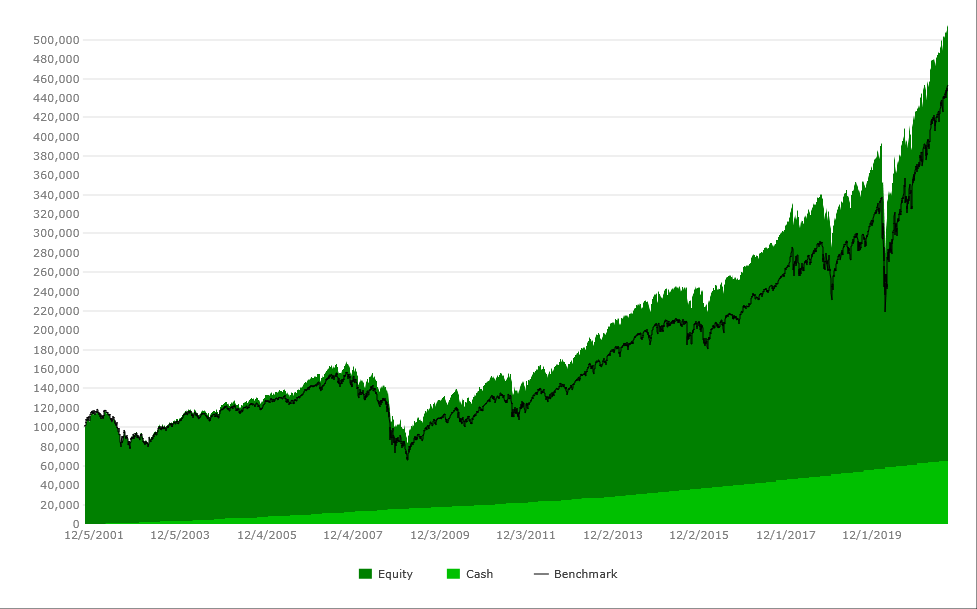
Here's my 20-year SPY simulation with dividends vs. SPY benchmark -
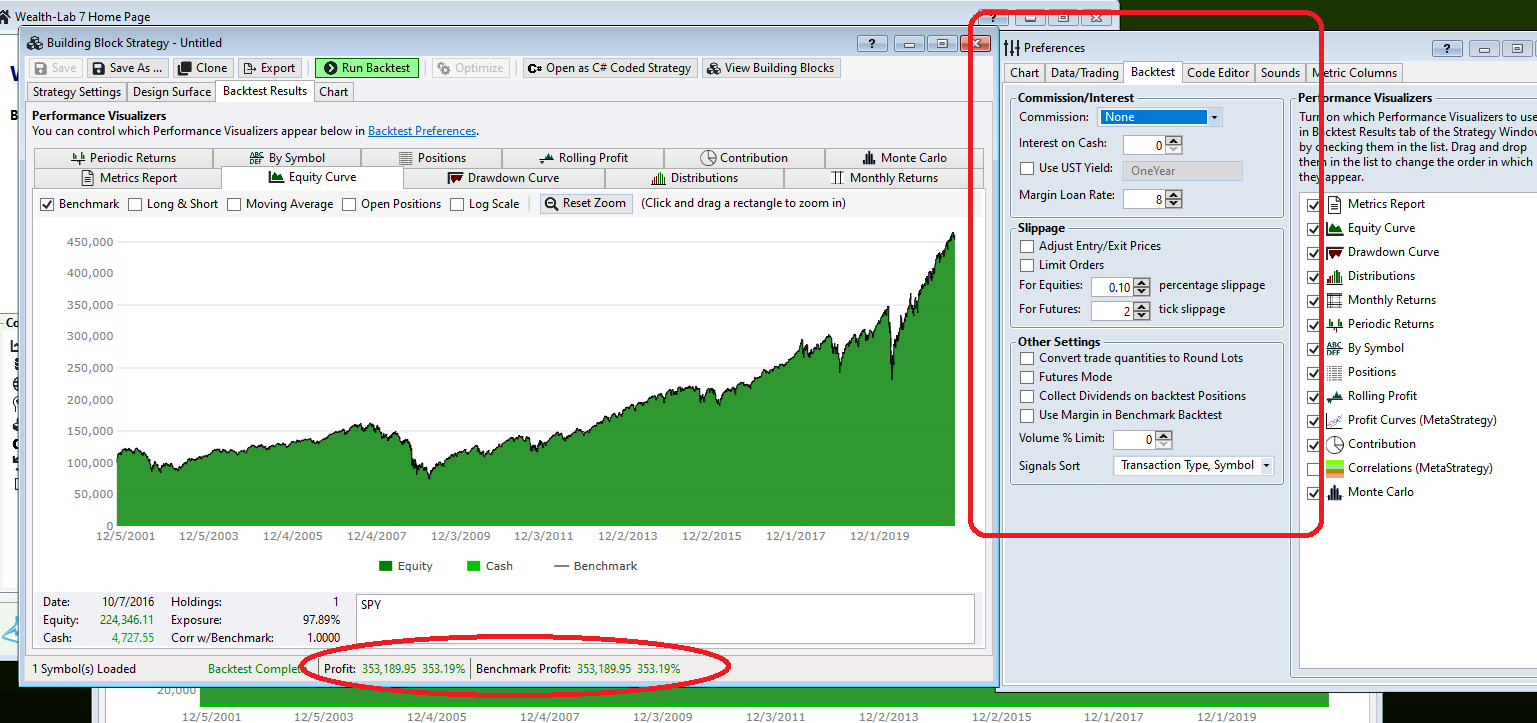
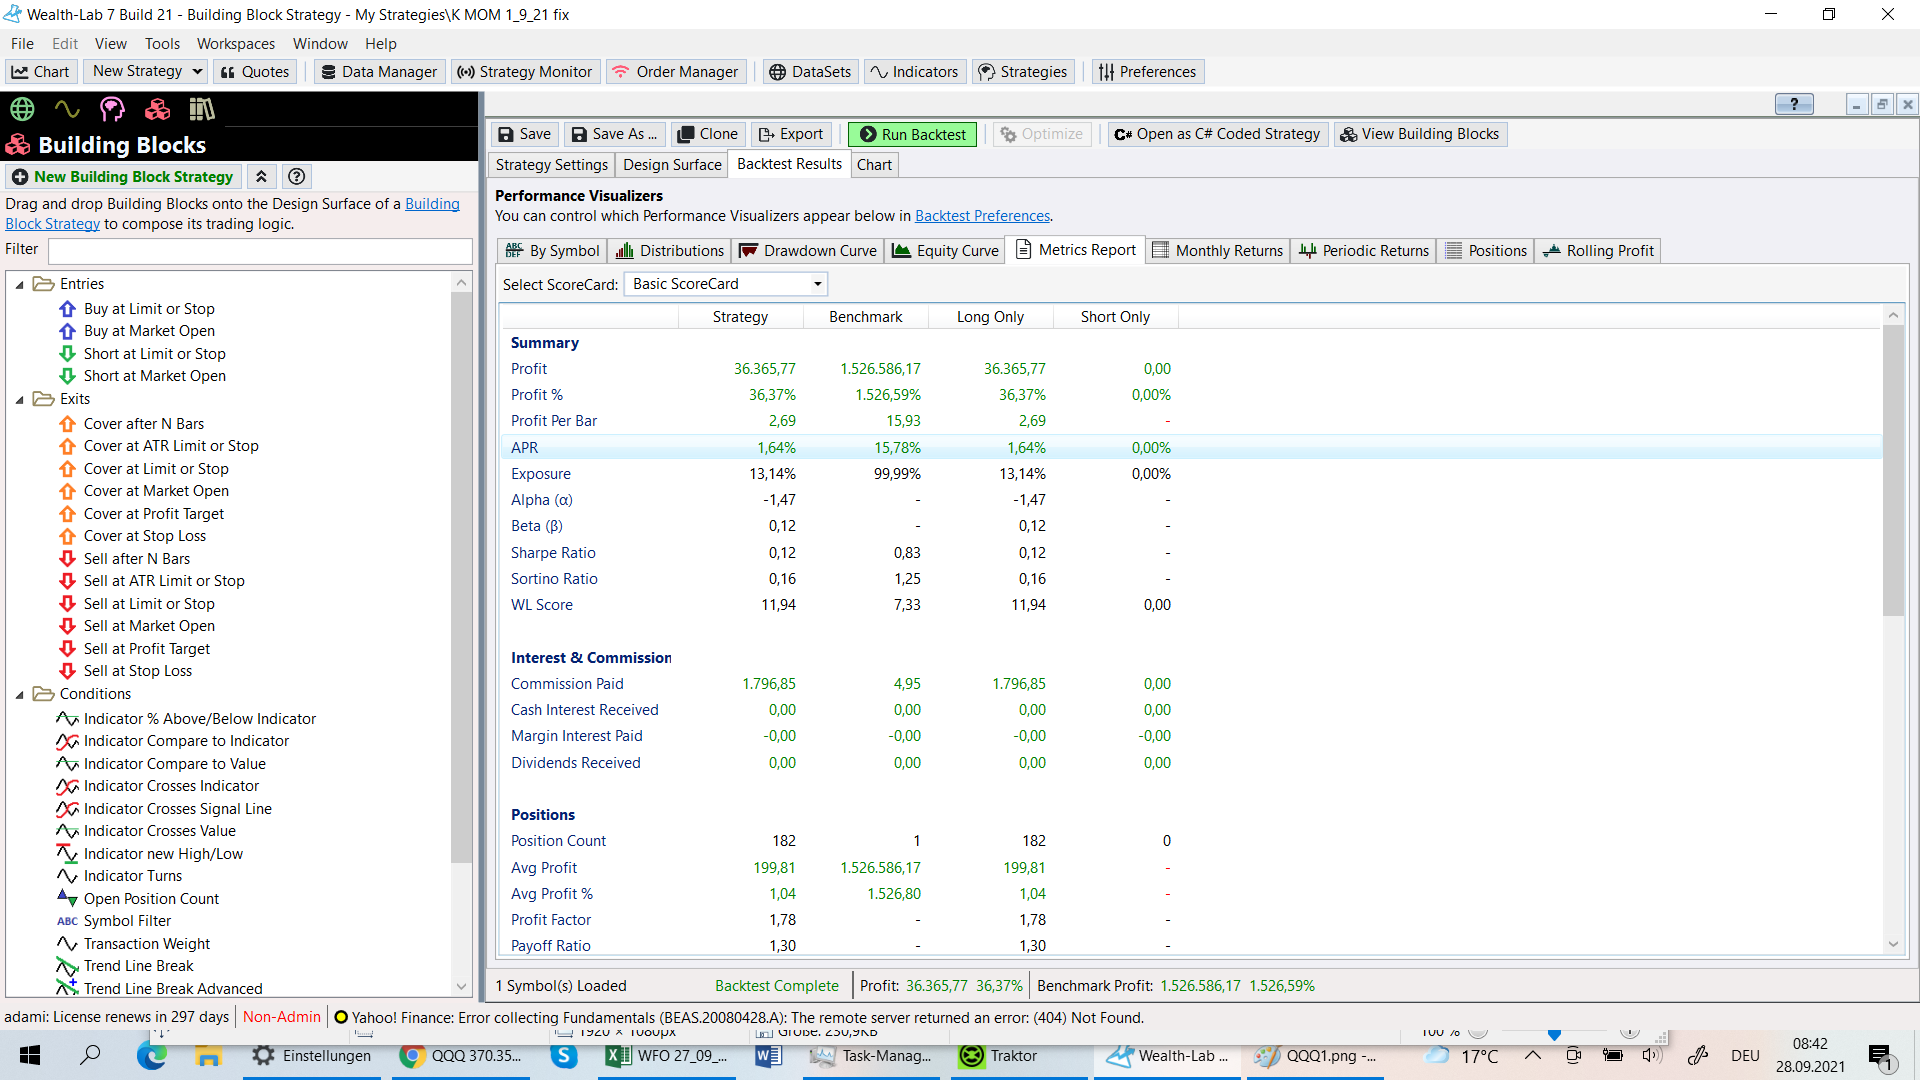
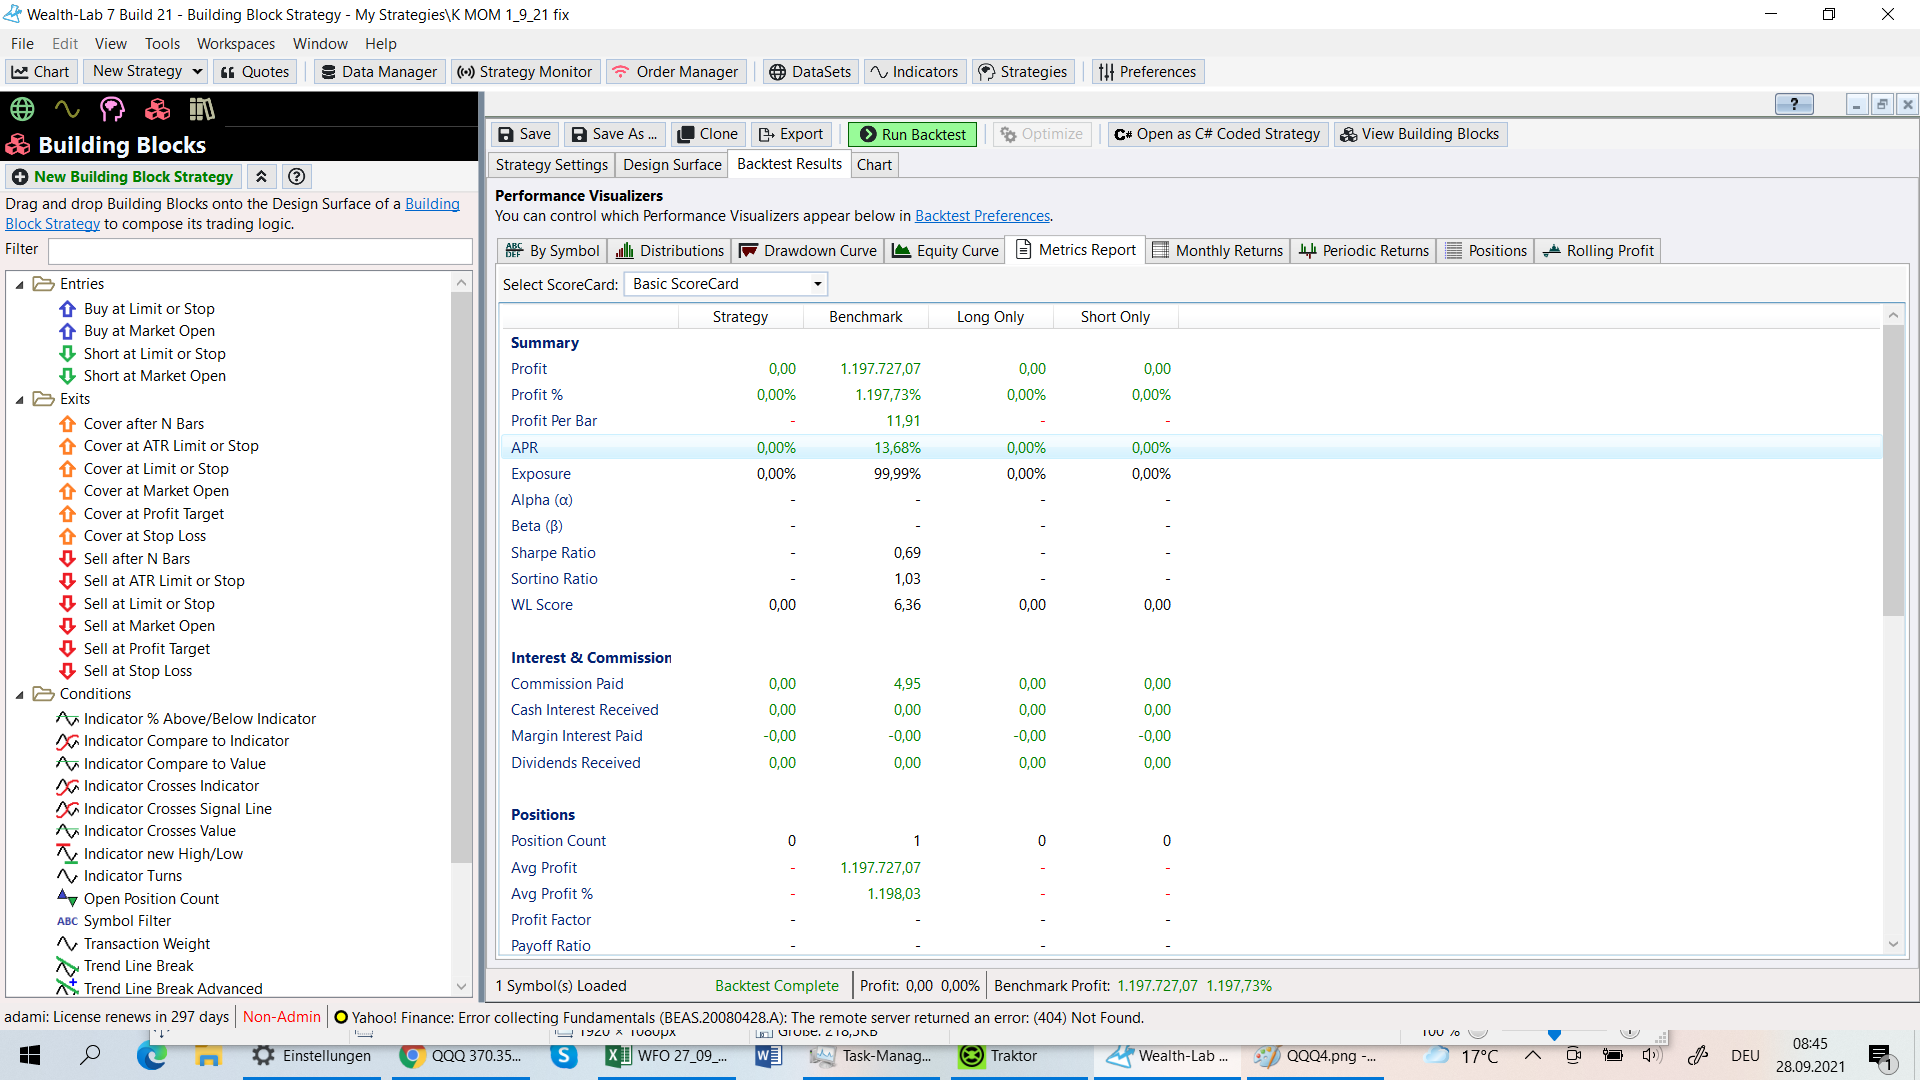
adami: Can you paste your complete metrics report? I can see similar results only with dividends enabled in Backtest settings.
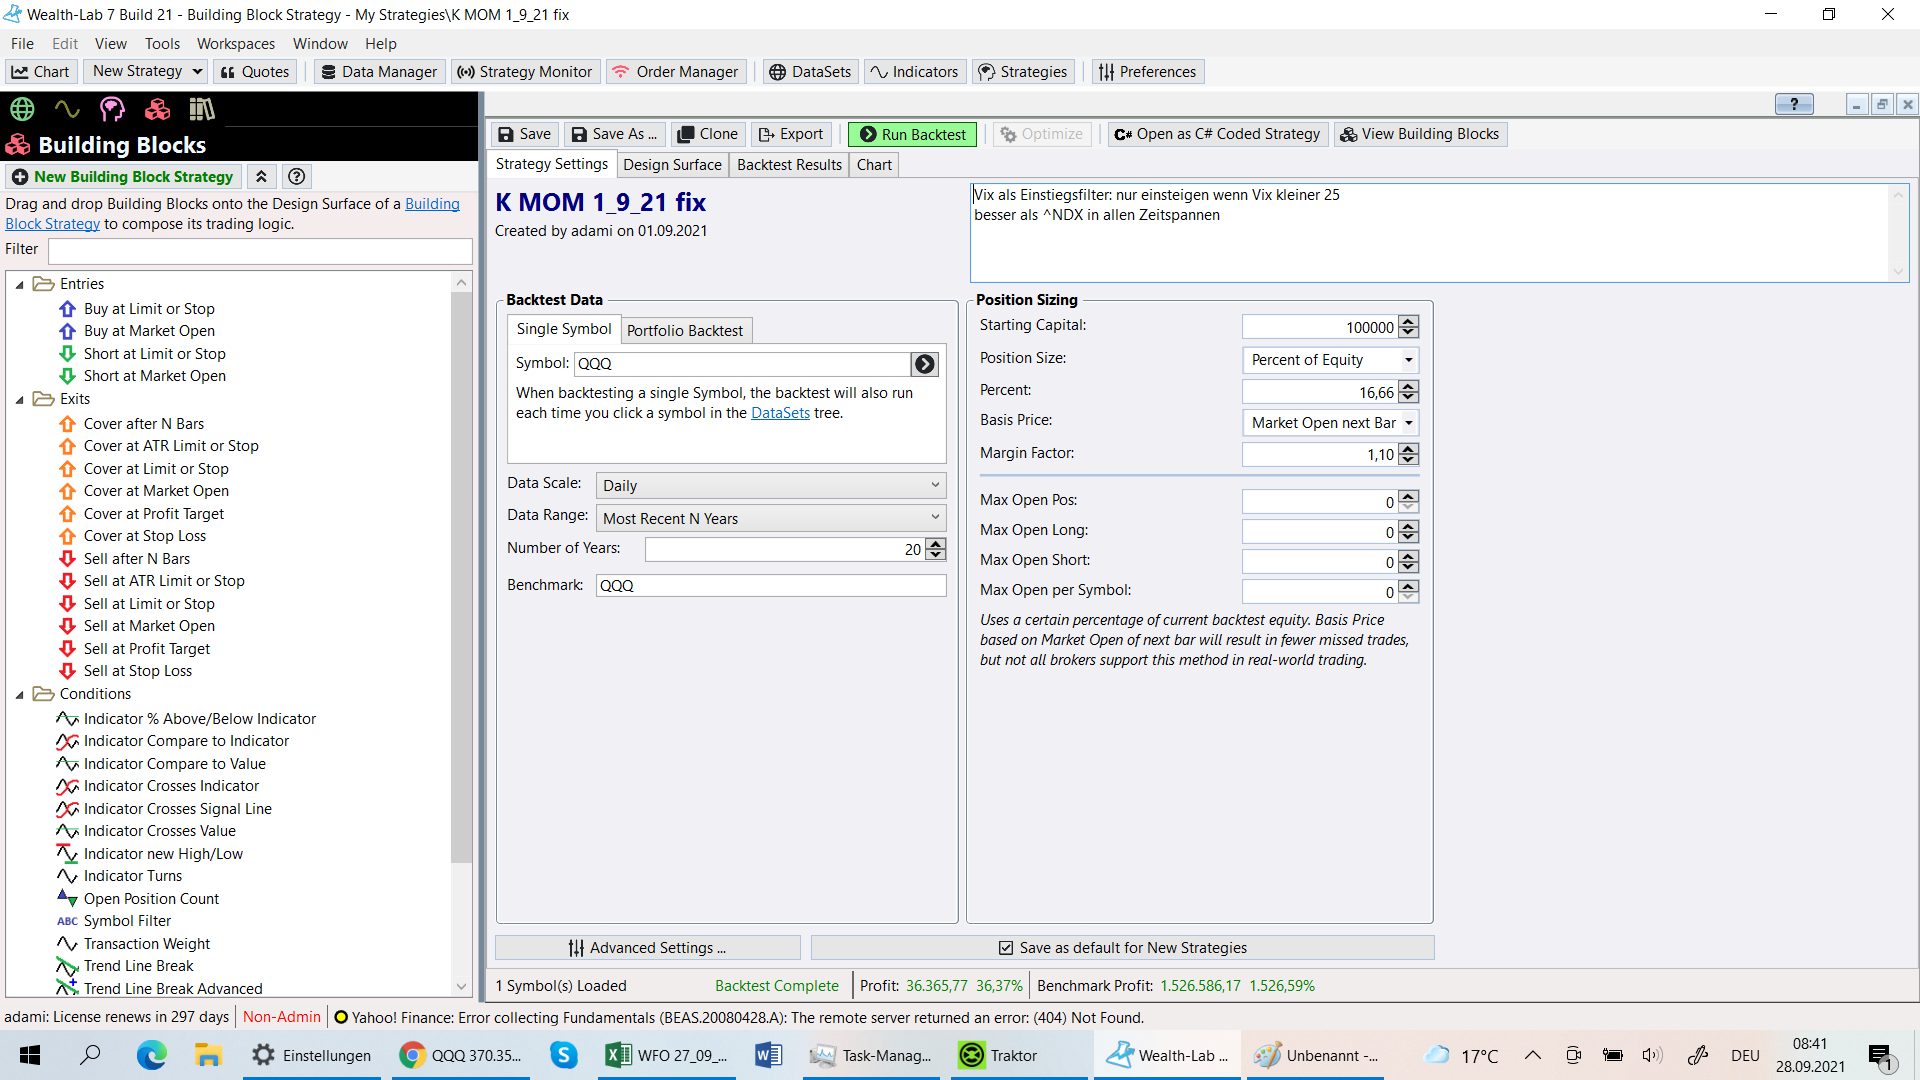
Also include your Backtest settings. I think even what I said before aboutn StartIndex isn't required. Here's a Building Block Strategy that simply has one Buy at Market block. Running on 20 years of SPY results in a 100% match with the benchmark for me.
Dividends are already included in Yahoo's data. Therefore, when we mark "Collect Dividends on backtest Positions", dividends are received twice.
Good point, best not to mark that then for Yahoo!
Added a warning to the Help and tooltip.
It gets even more interesting:
- there are different results for 16,20,21 years??
br
ka
- there are different results for 16,20,21 years??
br
ka
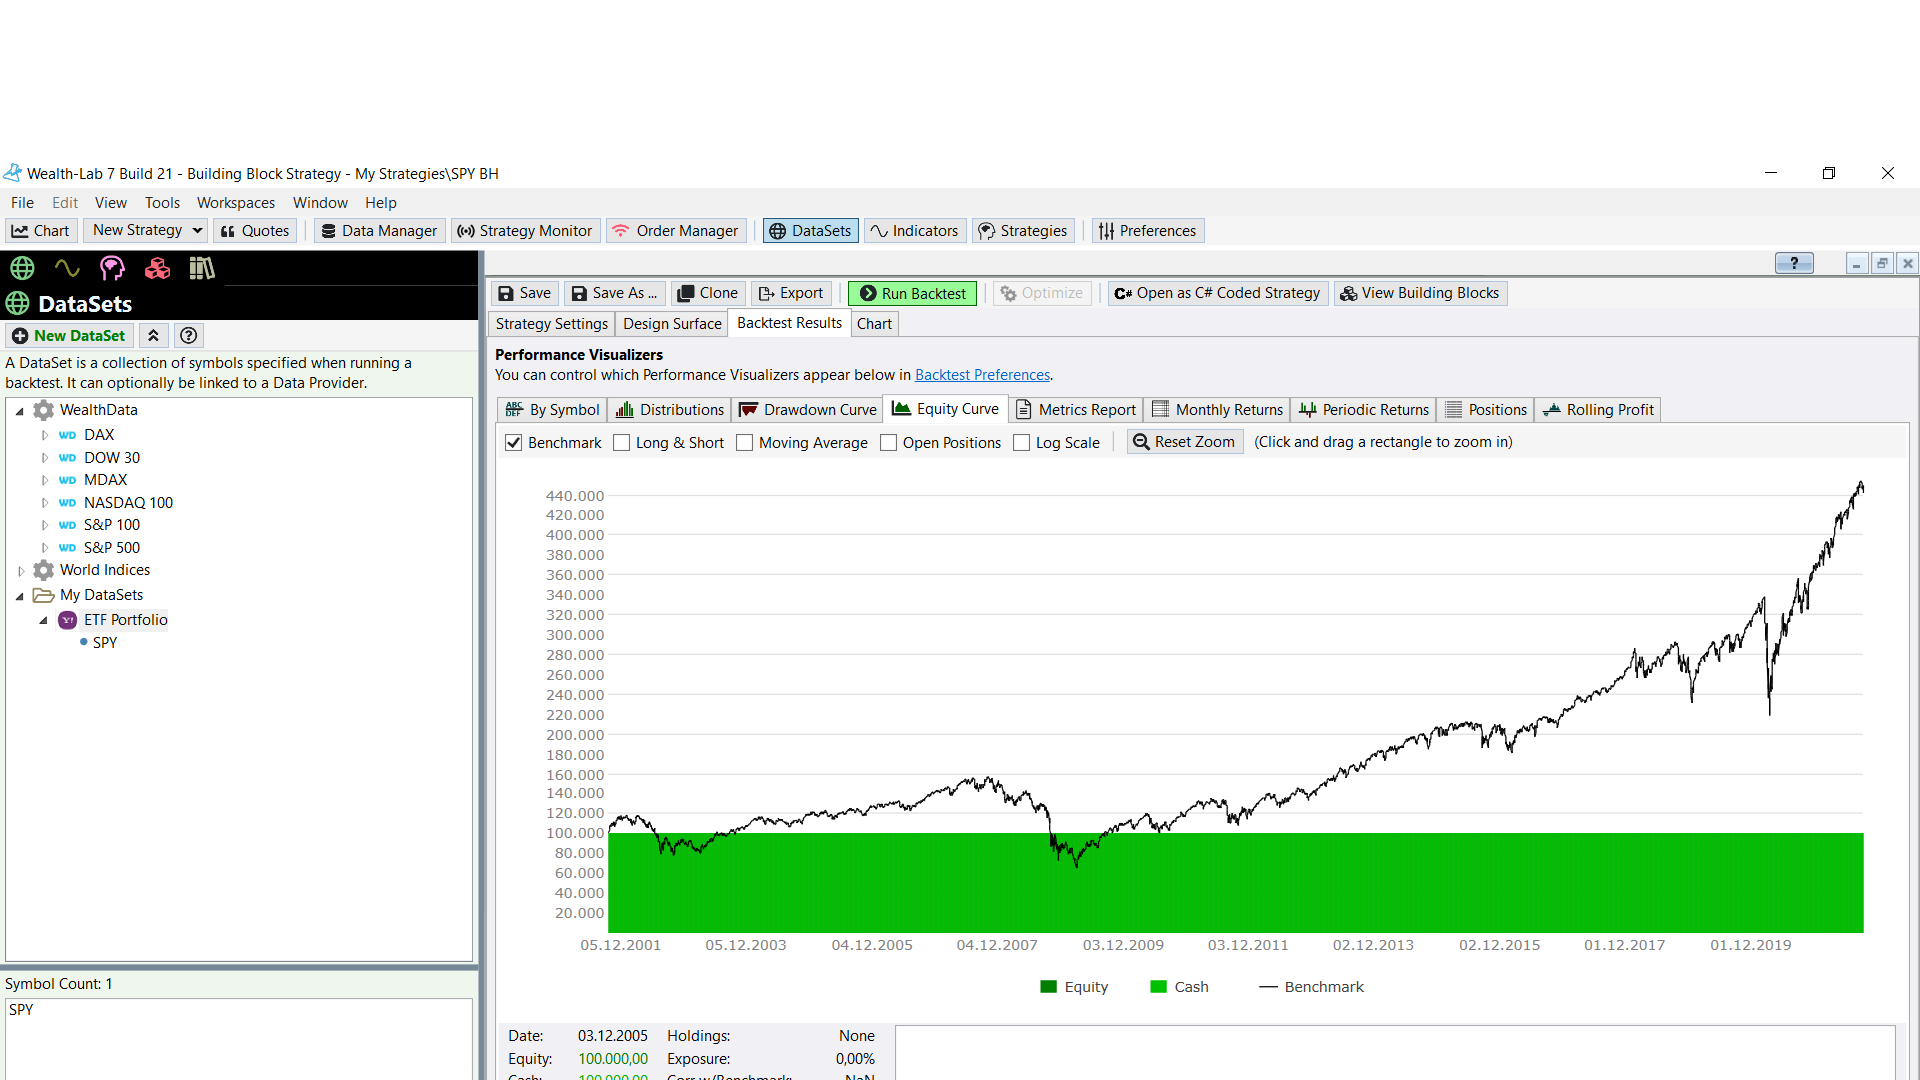
It looks like you're linking your Backtest DataSet to Yahoo! Finance. But the benchmark data will come from whichever Data Provider is top of the line in your Data Manager/Historical Providers tab. Probably WealthData?
As a test, can you, instead of doing a Portfolio Backtest, just backtest it in single-symbol mode using SPY. This will ensure that the data is coming from the same place.
If you want the benchmark to use Yahoo as well, make sure Yahoo is the topmost provider in the Data Manager, and it is "checkef off" - enabled.
Hi Glitch!
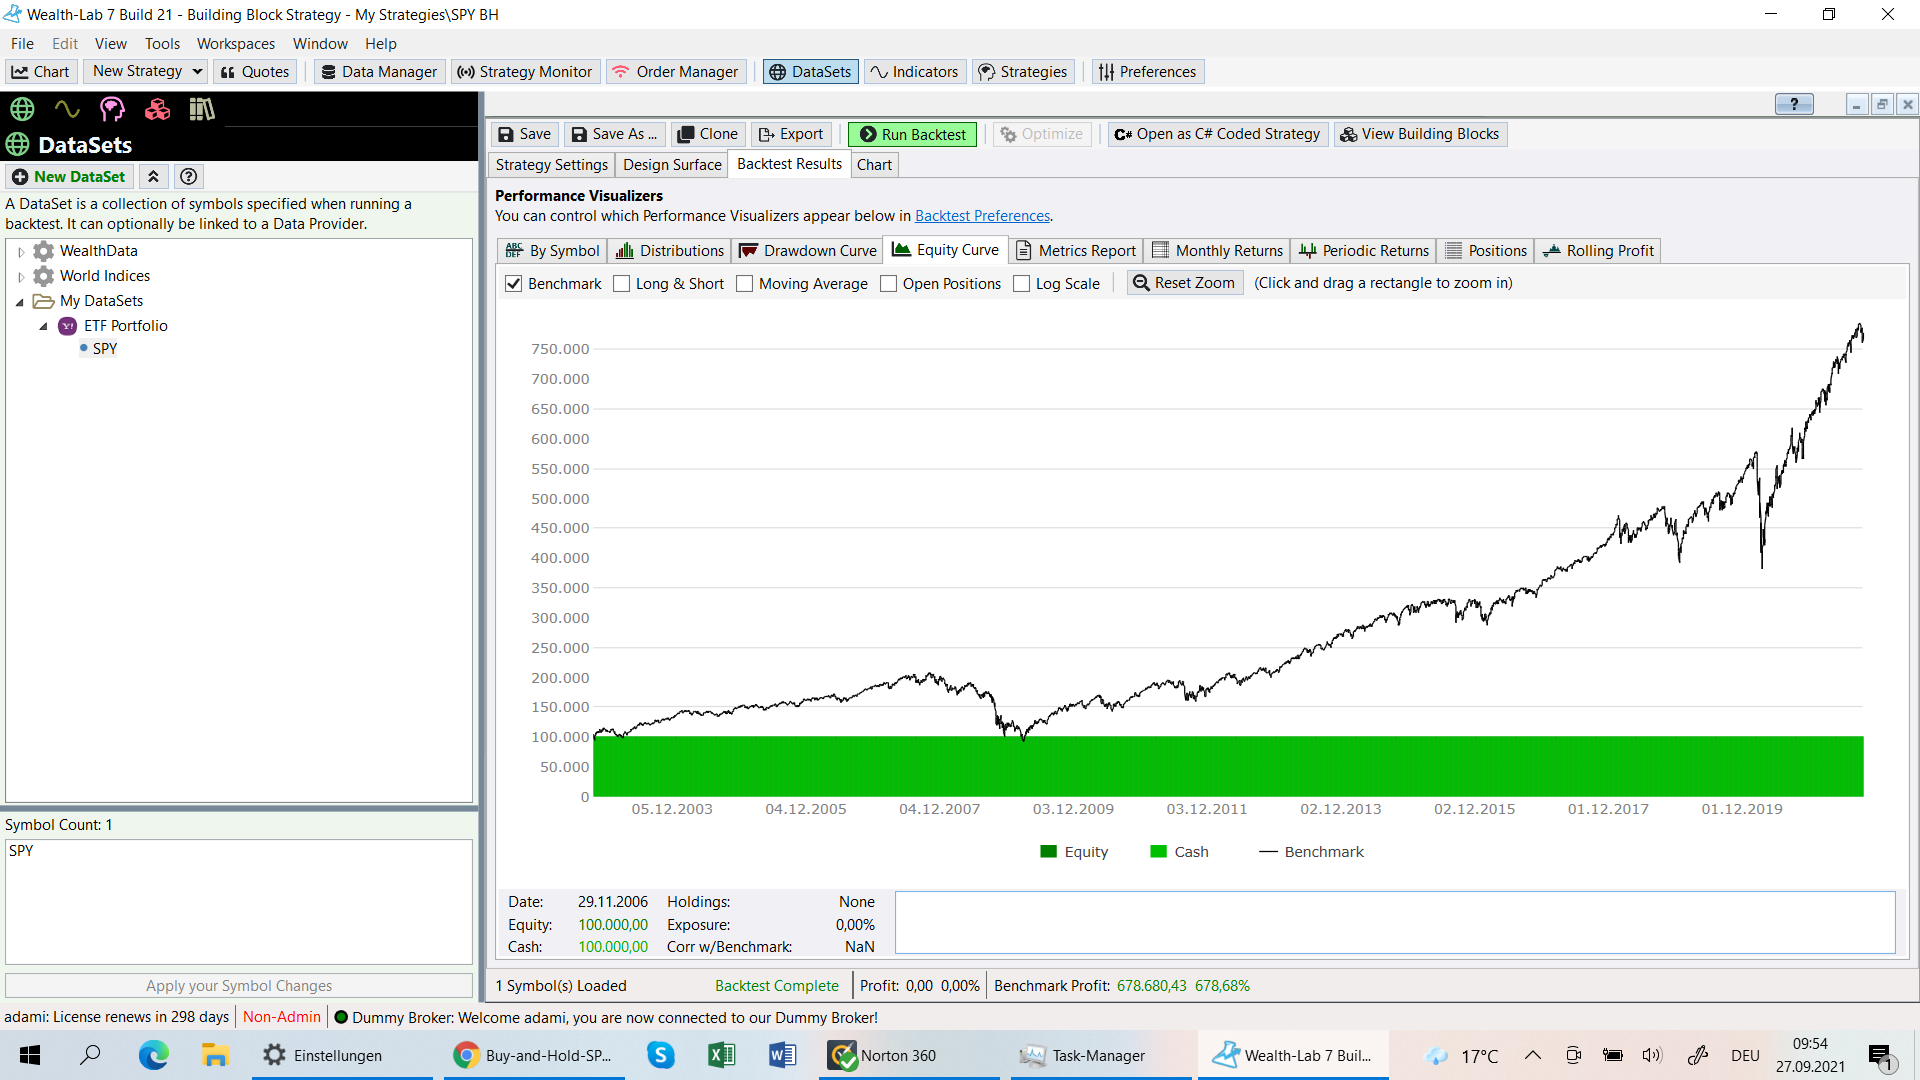
I tried now:
- only datasource is Yahoo
- Dividents off
- Single Stock SPY
Results:
- 20 Years ok
- 19 Years no result (see Chart)
- 18 Years ok
br
ka
I tried now:
- only datasource is Yahoo
- Dividents off
- Single Stock SPY
Results:
- 20 Years ok
- 19 Years no result (see Chart)
- 18 Years ok
br
ka
Although I cannot reproduce your results using 18 to 20 years of Yahoo data for SPY (the results match), there's a chance that the position couldn't be created in the 19 years backtest due to a gap? Since you must be using 100% equity for this test, try 1) setting Basis Price to "Market Open..." or 2) slightly bumping up the Margin factor.
Also you might want to right click a chart of SPY and choose "Reloading chart data..."
Also you might want to right click a chart of SPY and choose "Reloading chart data..."
It looks like you need a slight margin factor, maybe 1:2 to 1. It won't change the size of the position, but it will allow your strategy to take the position for cases where the market gaps up a little above the basis price.
I changed the price to "Market Open" no it works!
Thanks!
ka
Thanks!
ka
Not really!
There is a Bug when you change Dataproviders from Yahoo to WL or you check both.
Then you switch back and forth from Single stock to Portfoliotesting. So in some situations the Benchmark gets lower??
br
ka
There is a Bug when you change Dataproviders from Yahoo to WL or you check both.
Then you switch back and forth from Single stock to Portfoliotesting. So in some situations the Benchmark gets lower??
br
ka
The Benchmark computation seems to be wrong in WL Data:
1. QQQ
1. QQQ
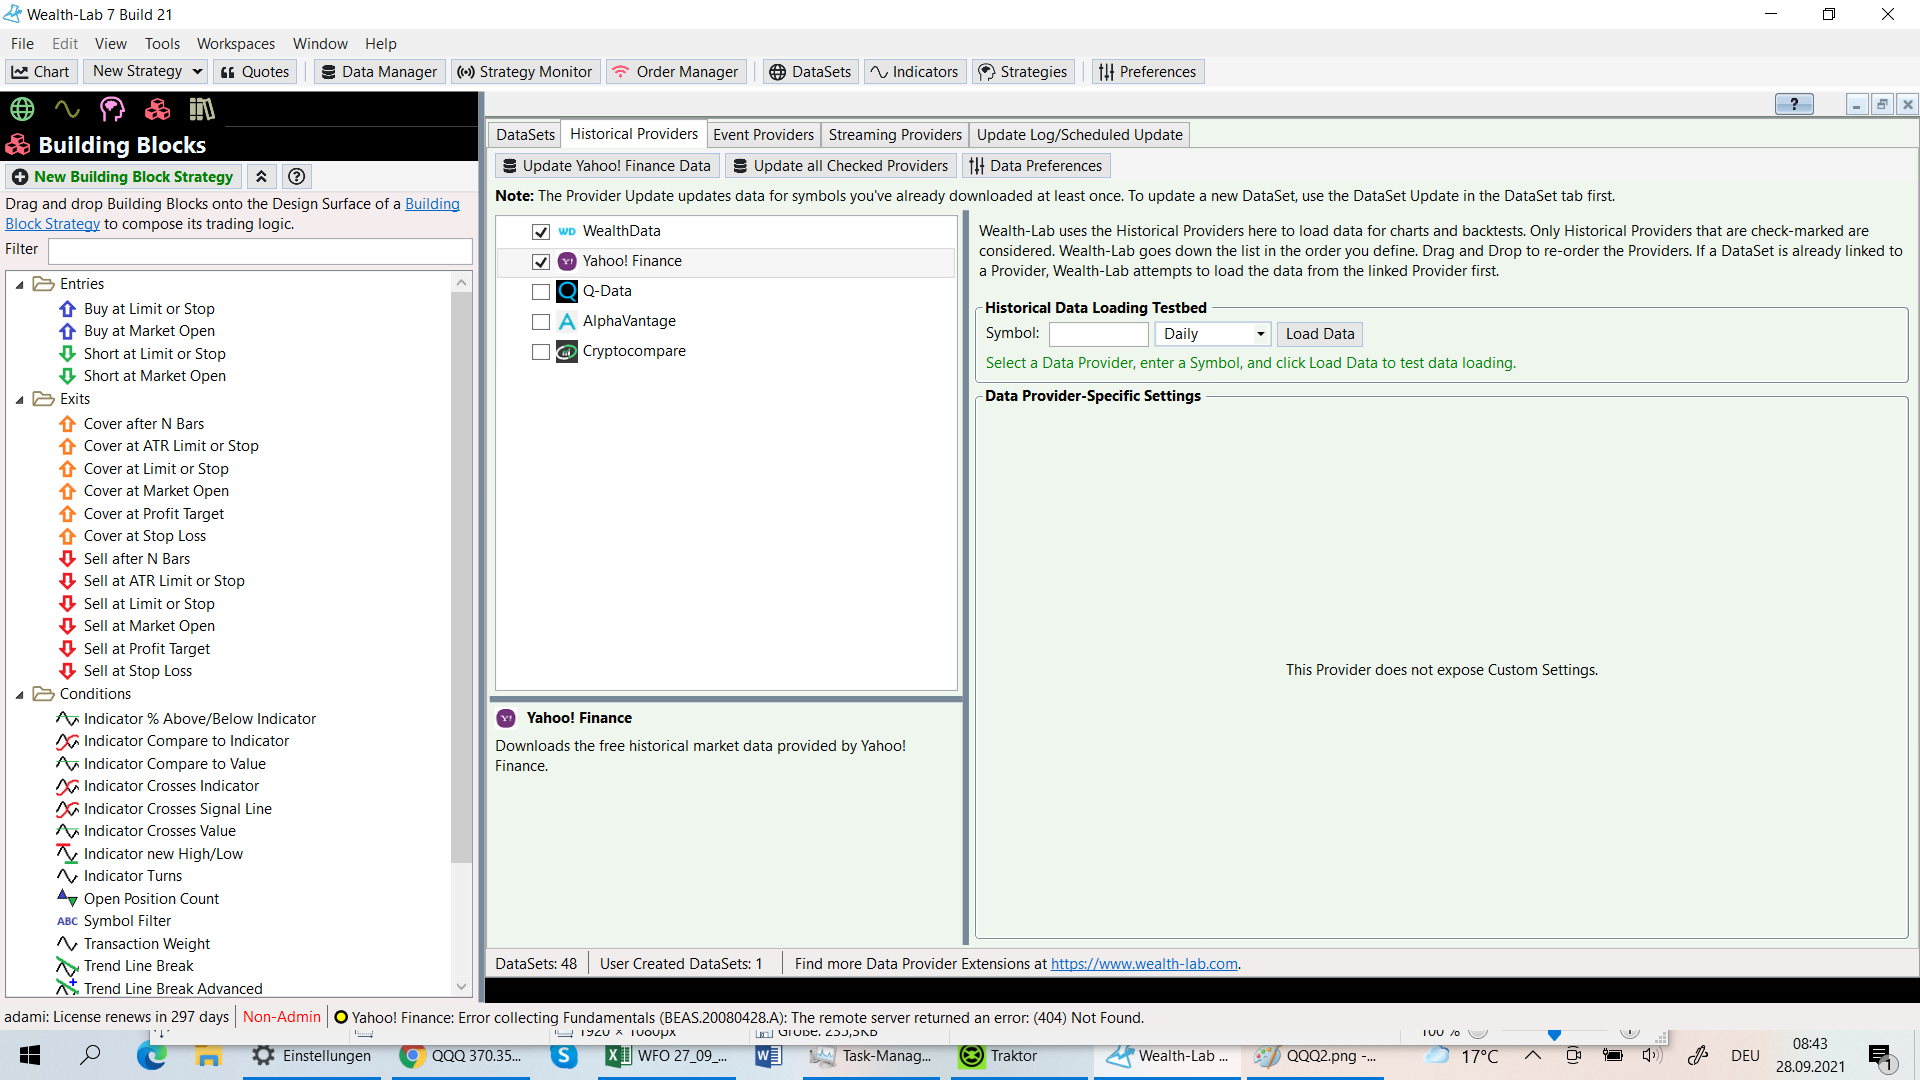
...here I checked first WD Data, then I unchecked Yahoo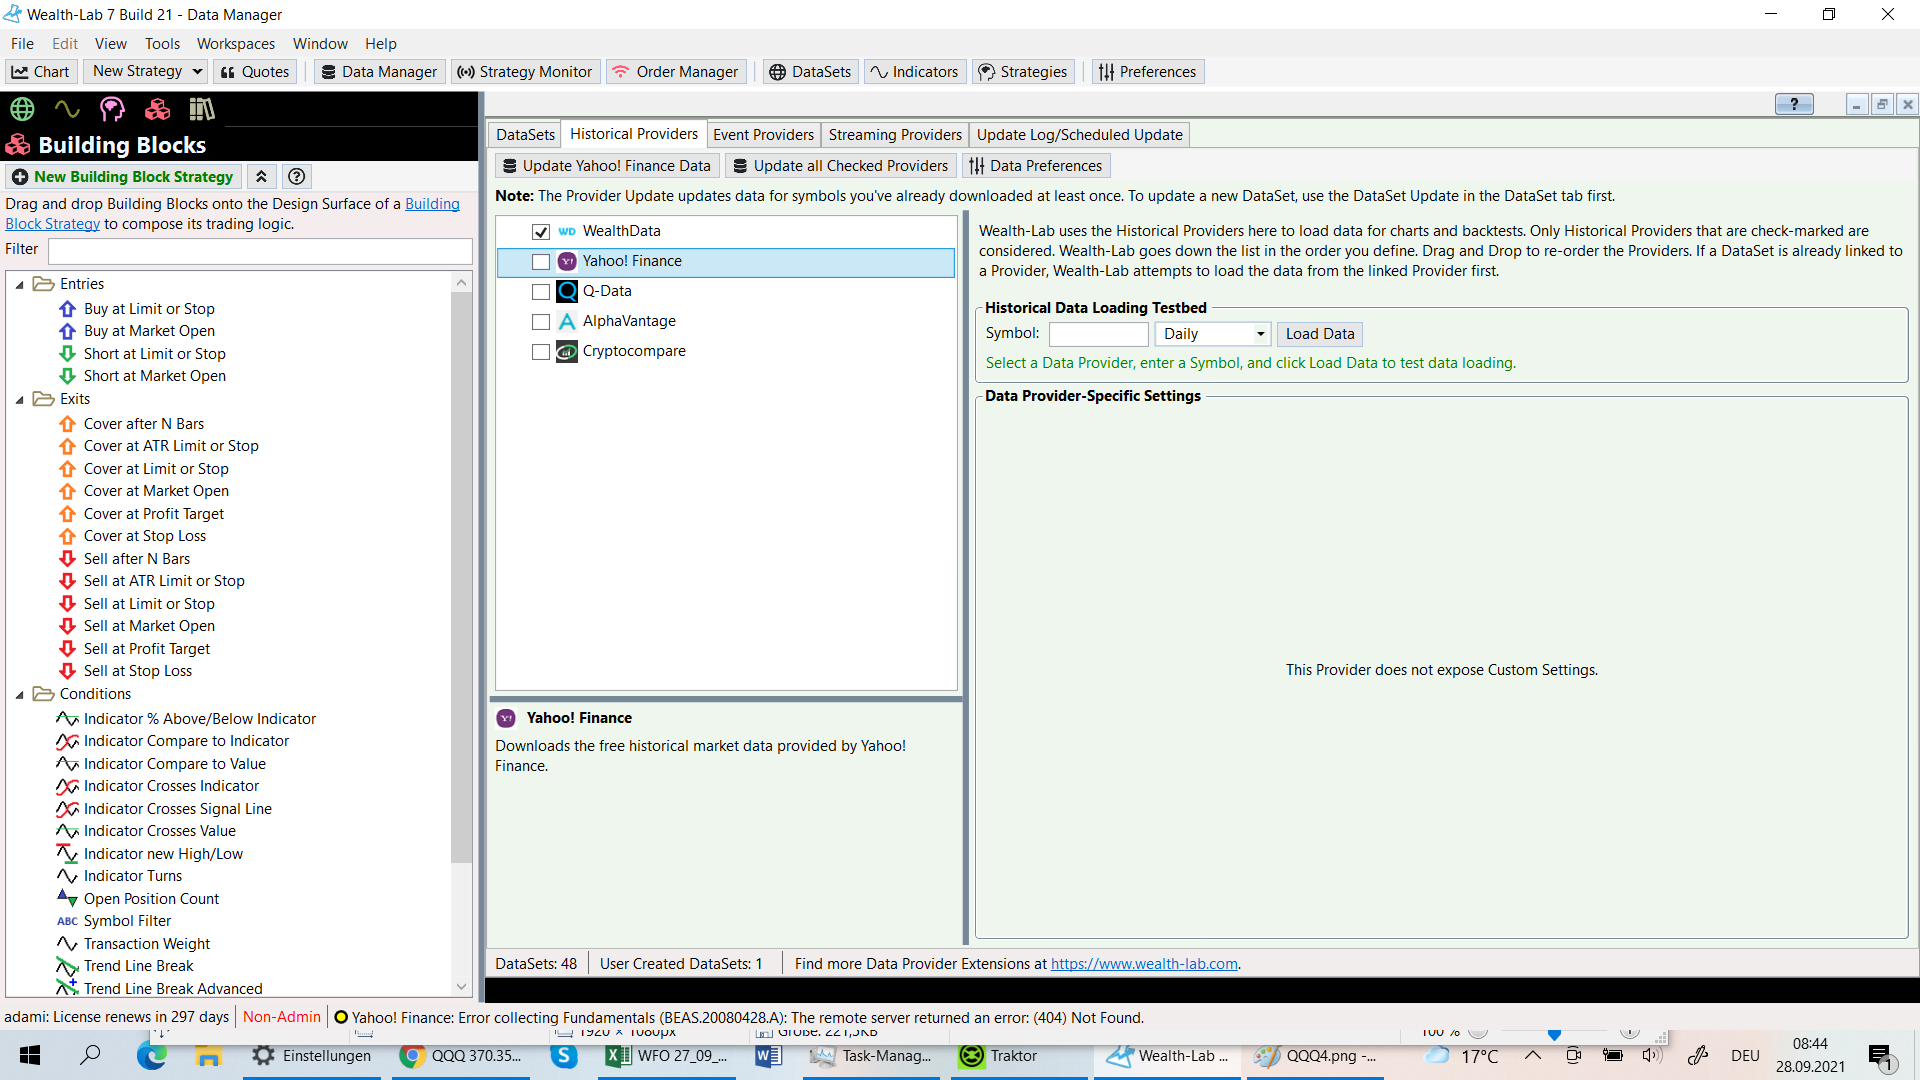

...and you see the Benchmark APR has changed
...these numbers do not correlate with Yahoo...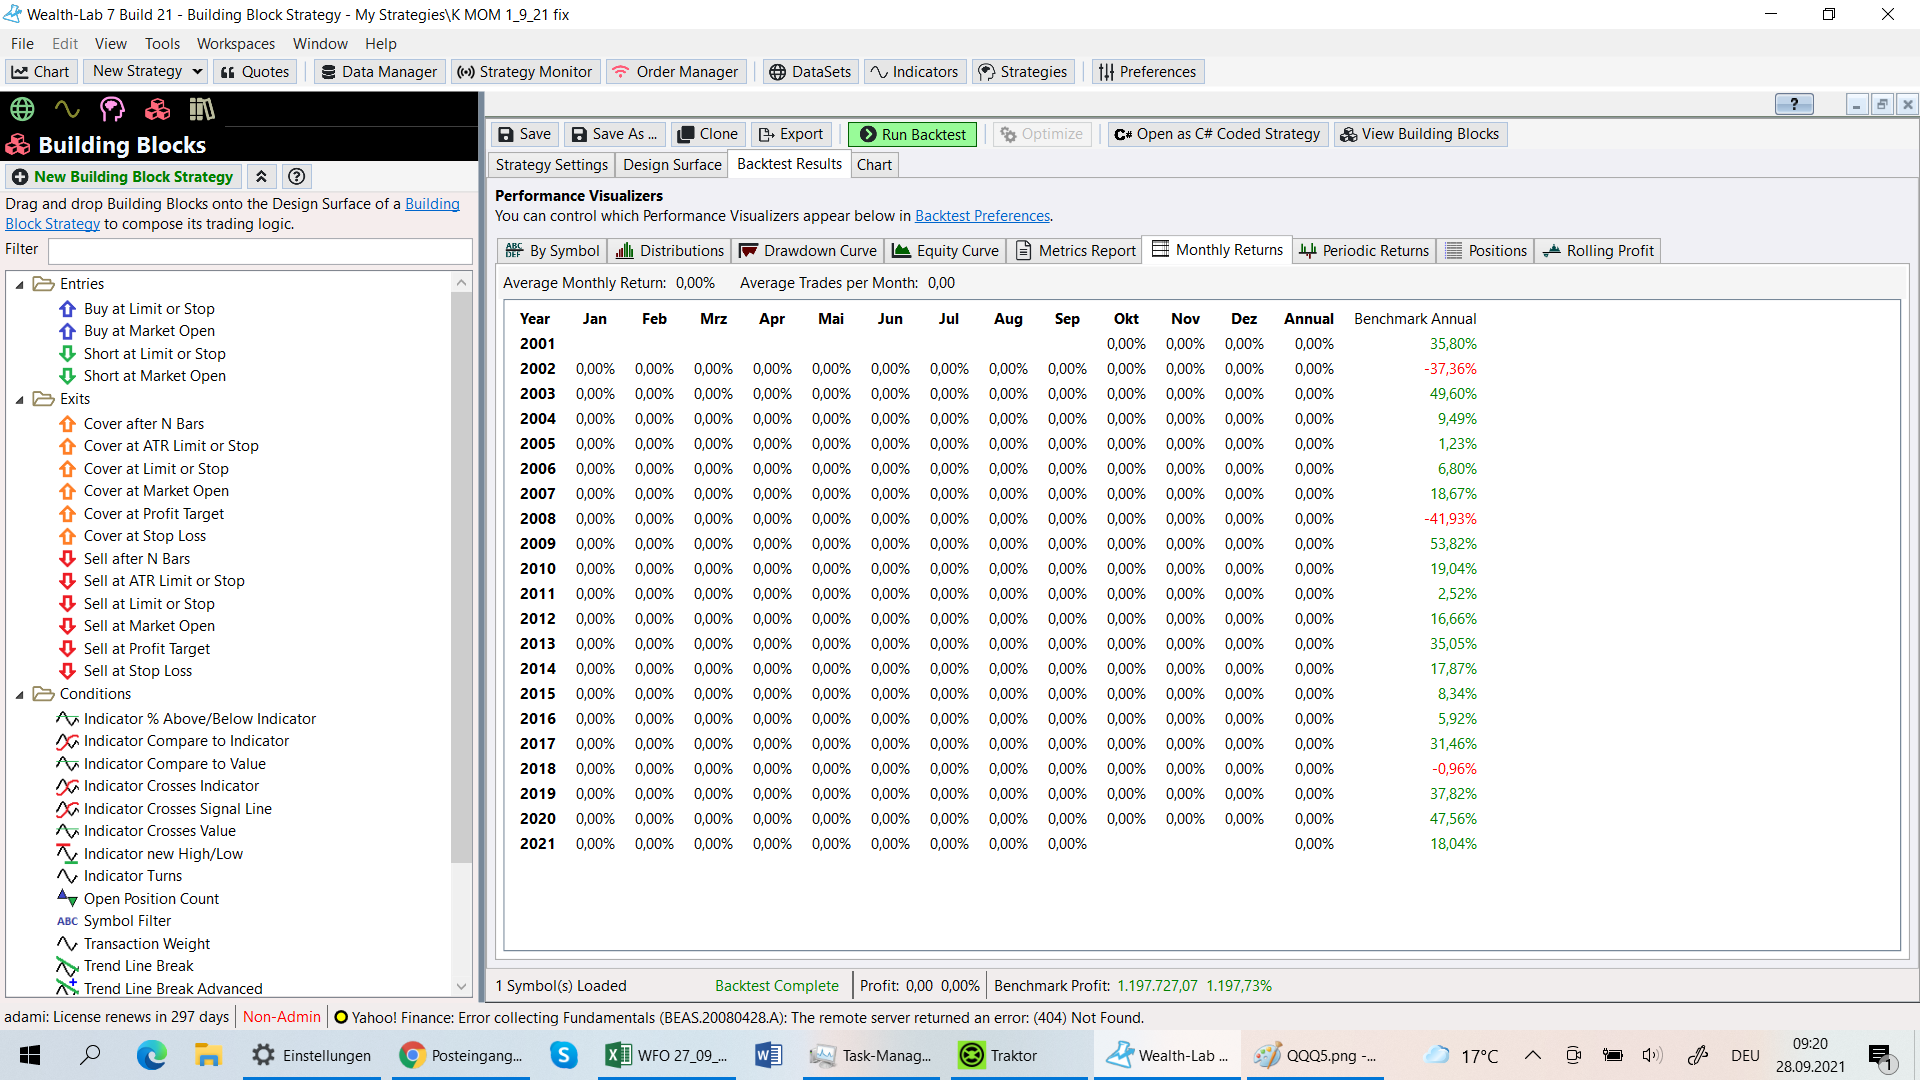
QUOTE:
The Benchmark computation seems to be wrong in WL Data:
It's a misconception, not a bug. Comparing apples (SPY @ 16% equity) to oranges (100% B&H performance) is nonsense.
Dear Eugene, I just talk about different computations of Benchmarks!
I can also send you a video of my computations, if you are not convinced.
br
ka
I can also send you a video of my computations, if you are not convinced.
br
ka
Dear Kurt,
But different data source means different benchmark values, isn't it?
But different data source means different benchmark values, isn't it?
Yahoo! data is back-adjusted for regular dividends. Those values will be different from Wealth-Data, IQFeed, and any other data provider that doesn't back-adjust for regular dividends.
Ok! Solved!
Thanks!
ka
Thanks!
ka
Your Response
Post
Edit Post
Login is required