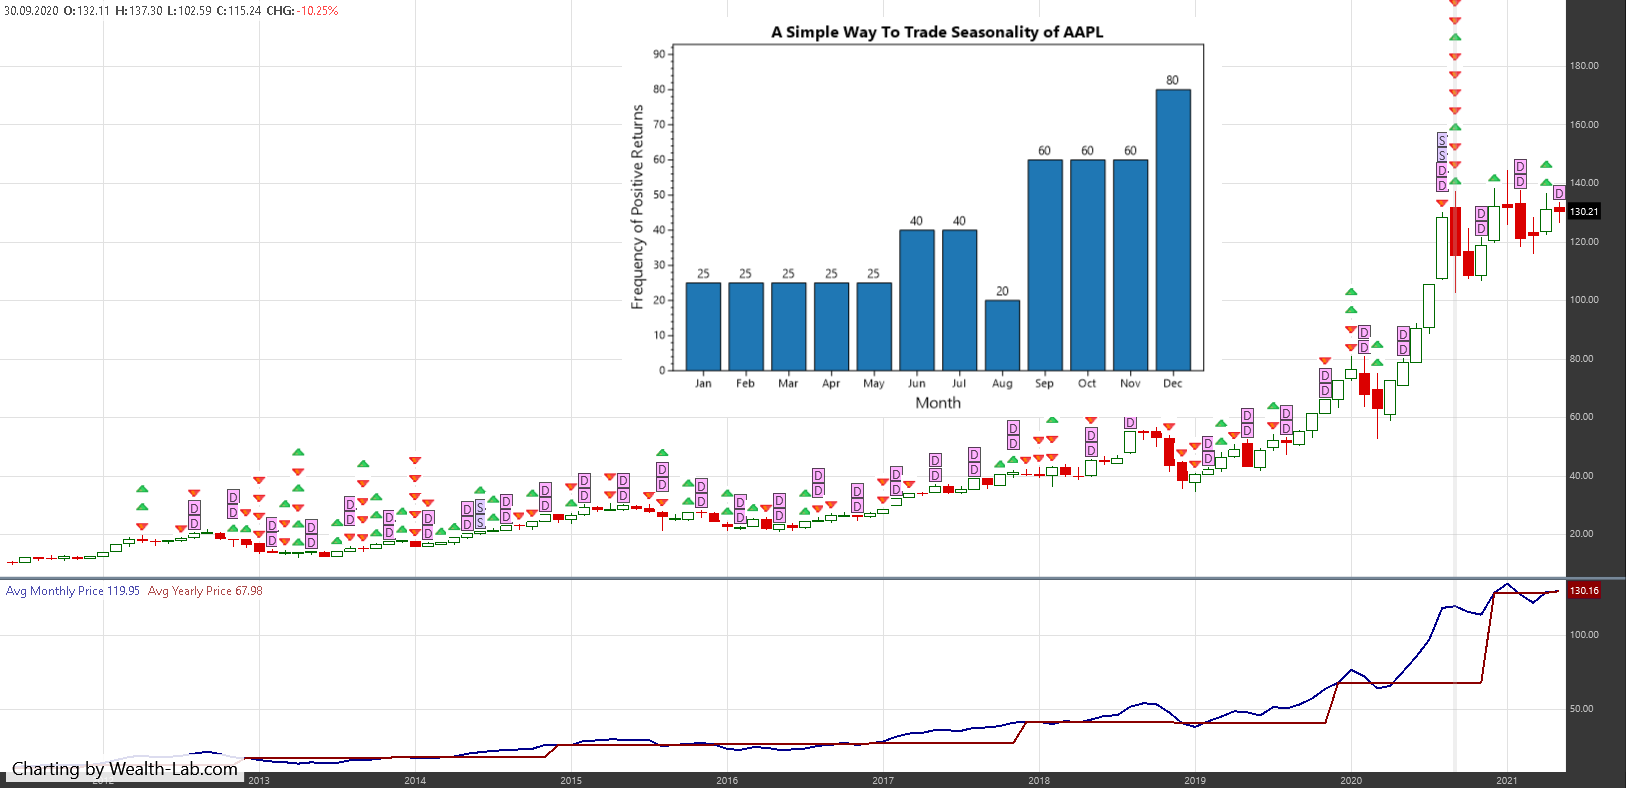
We're including a specially compiled version of a charting library called ScottPlot in Build 9. ScottPlot can create many different chart and plot types with just a few simple lines of code. You'll be able to plot these images to the chart using DrawImage and the new DrawImageAt methods.
More info on ScottPlot:
https://swharden.com/scottplot/cookbooks/4.0.47/
More info on ScottPlot:
https://swharden.com/scottplot/cookbooks/4.0.47/
Rename
And before you ask, yes we're thinking about how best to expose a new Visualizer tab that you could use to renter ScottPlot generated charts, or any other image content for that matter.
QUOTE:So you're saying we won't need to do lots of WPF manipulation to use ScottPlot? That would be handy.
... expose a new Visualizer tab that you could use to renter ScottPlot generated charts ...
I have a special request. Rather than writing intermediate image files to disk, if you could configure ScottPlot to output its "stream" into MemoryStream instead, that would be faster. https://docs.microsoft.com/en-us/dotnet/api/system.io.memorystream?view=net-5.0
The idea is to do all the local image storage in a MemoryStream type so it handles all the local garbage collection instead of the .NET garbage collector.
ScottPlot has a built in method to produce an in memory Bitmap from its plot. You can then take that Bitmap and pass it as the argument in DrawImage. So yes, this is all without any WPF coding at all. It’s quite a simple and well done plotting library.
At first we tried to power this up with Steema TeeChart since it's built in but rendering or creating an in memory bitmap won't work.
And exposing a potential Visualizer tab would be a step forward for power users. The simplest use case would be making it a visual "WriteToDebugLog" tool on steroids!
Think populating an object with data,letting WL7 do the binding (oops, ScottPlot doesn't support MVVM), and then switching the chart type on the fly via a dropdown box on the visualizer tab.
And exposing a potential Visualizer tab would be a step forward for power users. The simplest use case would be making it a visual "WriteToDebugLog" tool on steroids!
Think populating an object with data,
@Glitch
In Quantacula you started to develop a Seasonality Indicator. I remember that you even presented a first prototype of it. Was this project put on hold at that time?
In Quantacula you started to develop a Seasonality Indicator. I remember that you even presented a first prototype of it. Was this project put on hold at that time?
Indeed, that project was put on hold once we began the WL7 work.
At that time, I integrated it as header text into the chart, but today I would have no problem to pay for the indicator as an additional extension.
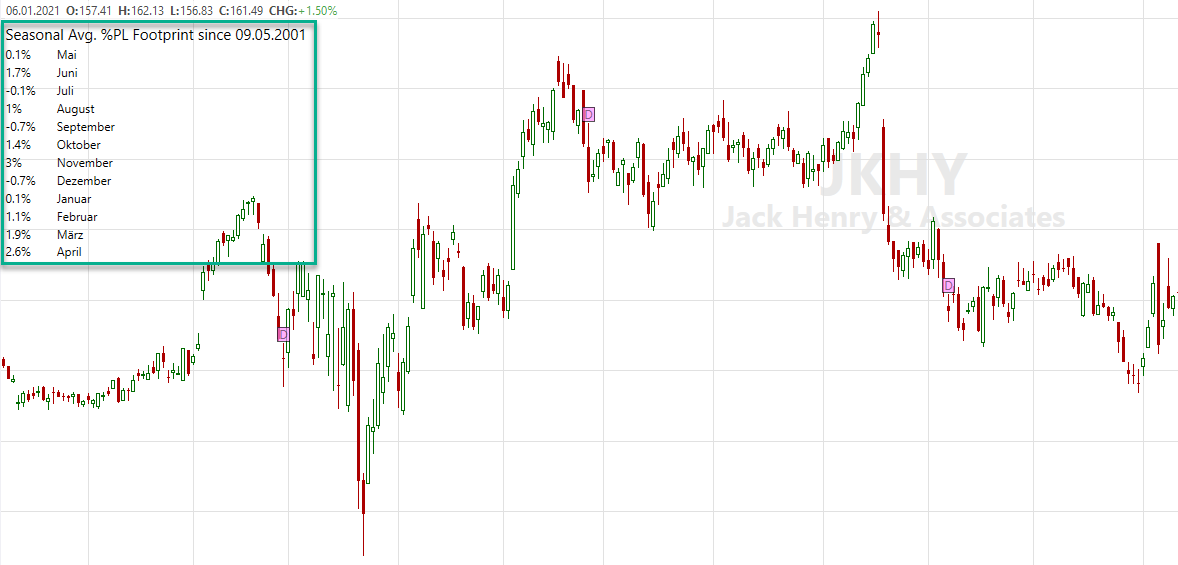
Let me see if we can bring that QS indicator in WL7 base product. There’s not enough there now to justify putting it into an extension.
Your Response
Post
Edit Post
Login is required