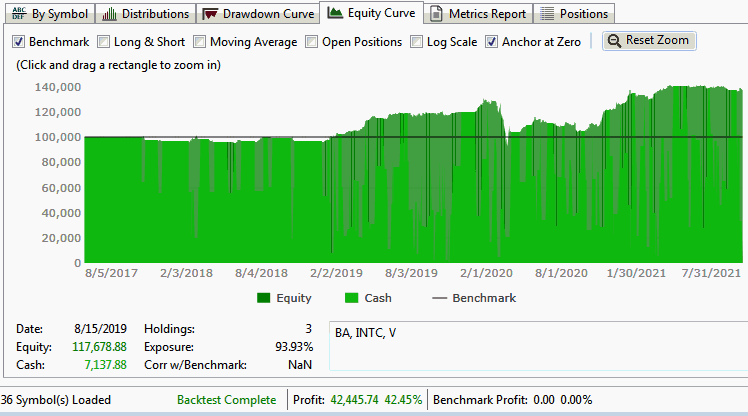
When I run my strategies on WL7, the benchmark plot (for SPY) always flat lines, see screenshot. However, when I run the sample strategies included with WL, the benchmark plot works as expected. So this problem has nothing to do with a "global" preference. Is there a preference setting specific to a strategy I'm missing that needs adjusting?
In addition, is there a way to include a buy-and-hold benchmark plot, like WL6 has, on the equity curve? Or is this a feature request?

In addition, is there a way to include a buy-and-hold benchmark plot, like WL6 has, on the equity curve? Or is this a feature request?
Rename
Hmm did you maybe change the benchmark symbol?
And yes the old style Buy and Hold would need a new request. Since WL7 can work with dynamic DatSets where symbols mights get added or removed as time goes on, the simplistic approach WL6 took won’t work.
And yes the old style Buy and Hold would need a new request. Since WL7 can work with dynamic DatSets where symbols mights get added or removed as time goes on, the simplistic approach WL6 took won’t work.
QUOTE:
Hmm did you maybe change the benchmark symbol?
So you can't reproduce it? Interesting. No, SPY is still the benchmark symbol. What's interesting is the problem only exists for "SPY" as the benchmark. Any other benchmark stock seems to work fine. Even the "empty strategy" below has the problem.
CODE:That suggests to me the problem is not in the strategy code. So where is the problem located?
using WealthLab.Backtest; using WealthLab.Core; namespace WealthScript13 { public class MyStrategy : UserStrategyBase { //create indicators and other objects here, this is executed prior to the main trading loop public override void Initialize(BarHistory bars) { } //execute the strategy rules here, this is executed once for each bar in the backtest history public override void Execute(BarHistory bars, int idx) { } //declare private variables below } }
I don’t have enough information to know, my next guess would be scale. Is it running intraday for example? What’s the data range?
Settings are below. So why is SPY "special" over all other symbols?
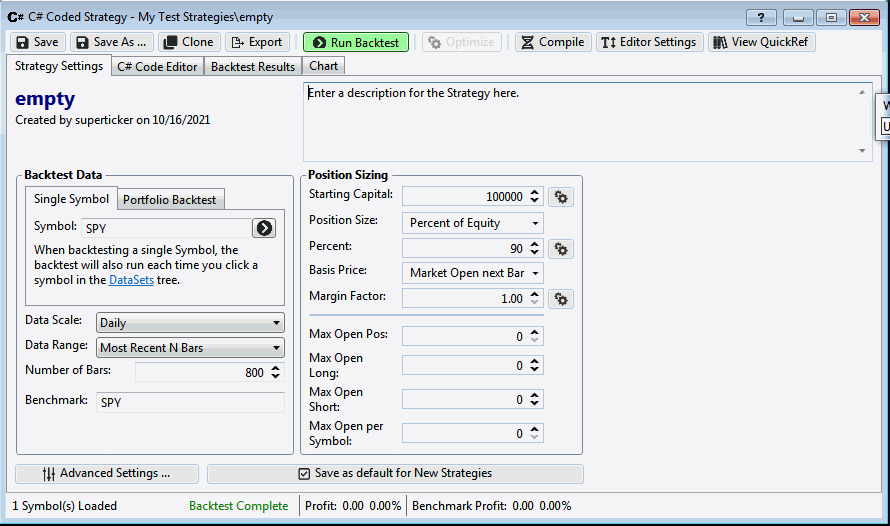

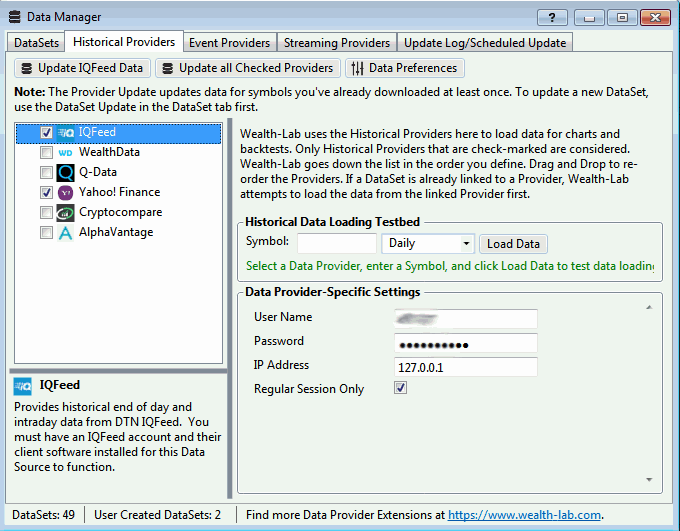
When I copy your settings in an empty Strategy I do get a BM Equity Curve. Next question, can you paste your Data Manager, Historical Providers tab?
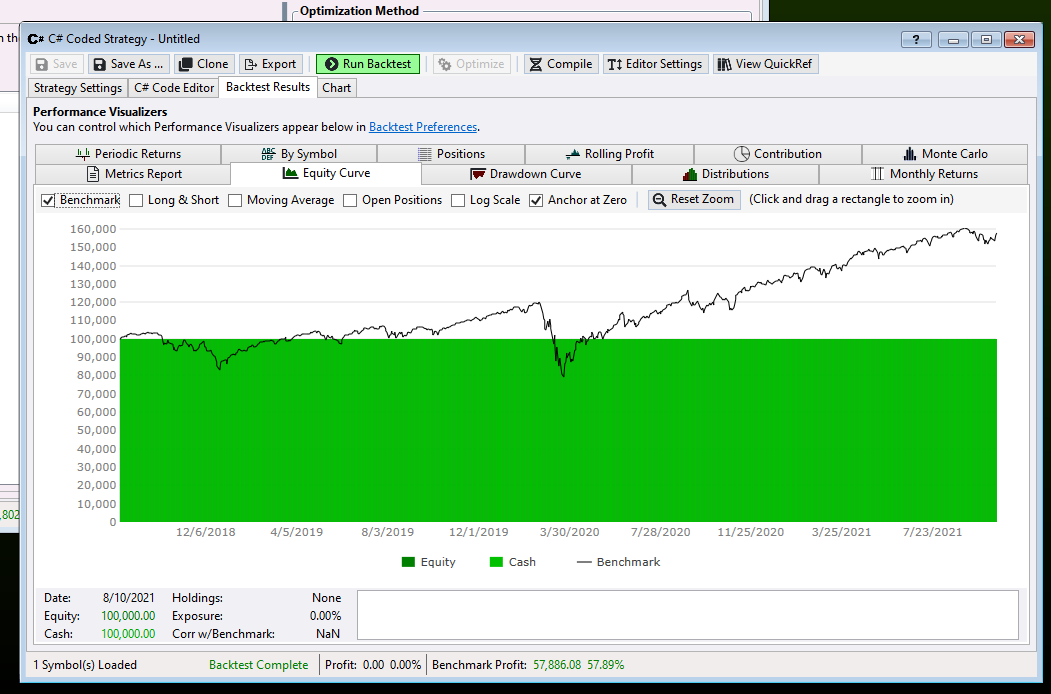

But why do the sample strategies work successfully with SPY? The historical provider settings would be shared for all strategies. Right? Or am I wrong somehow? What am I missing?
Are the sample strategies seeing different settings than my own strategies? Is there a variable scoping problem? If so, why is this scoping problem isolated to SPY?
Are the sample strategies seeing different settings than my own strategies? Is there a variable scoping problem? If so, why is this scoping problem isolated to SPY?

Okay, I ...
1) Took the "Seventeen Liner" sample strategy and ran it successfully with SPY.
2) I Pasted in the "empty strategy" into that strategy (without saving it) and ran in unsuccessfully with SPY.
3) I then used the "Undo" Edit command to revert it back to the "Seventeen Liner" sample strategy and ran it successfully.
4) I can use "Redo" to reverse it again bringing back the problem.
My "tentative conclusion" is the WL internal editor is somehow involved. But why isn't everyone else seeing this problem if it's a scoping problem with the editor? And why is it isolated to SPY? Something is not right.
I agree, I don't have any immediately epipahnies here but if I do I'll post them back here ASAP!
I found a clue. With the code below, this strategy works fine with SPY. However, if I change StartIndex from 5 to 2, the SPY benchmark flat lines. If I change it back to 5, it works again.
CONCLUSION: It's a cached data problem with SPY--weird! The first few values must be corrupted unique to my machine. I tried reloading SPY from the chart, but that doesn't fix it.
So how do a purge all copies of SPY, restart WL, and reload SPY from scratch? Is there a cache file I can delete to kill SPY? If I can't fix the SPY corruption, I'll just use a different benchmark. I still don't understand why the sample strategies work okay, but their StartIndex is different so they may work around the SPY data corruption.
CODE:
using WealthLab.Backtest;
using WealthLab.Core;

namespace WealthScript16
{
    public class SeventeenLiner : UserStrategyBase
    {
        //create indicators and other objects here, this is executed prior to the main trading loop
        public override void Initialize(BarHistory bars)
        {
         StartIndex = 5;
        }

        //execute the strategy rules here, this is executed once for each bar in the backtest history
        public override void Execute(BarHistory bars, int idx)
        {
        }

   }
}
You can temporarily uncheck IQFeed or put Yahoo on top of it in the DM to prove or disprove that it's IQFeed's data file issue. Better restart WL7 to clear any caches.
QUOTE:
You can temporarily uncheck IQFeed or put Yahoo on top of it in the DM to prove or disprove that
I just tried that. Here's what I discovered when an 800 bars Data Range is selected.
1) When IQFeed is selected as the SPY source, StartIndex's below 4 fail. Values above 5 all work.
2) When Yahoo is selected, StartIndex's below 9 work okay, but values above 10 fail.
These steps are reversible by switching data sources. My conclusion is the data sources aren't necessarily corrupted, but there are small differences between them. That in itself seems wrong to me, but I don't care about that.
What is a problem is that the plotting routine for the benchmark is sensitive to these small differences at the very beginning of the TimeSeries. Why would that be?
Also, why is StartIndex a controlling factor in the first place? Does this variable affect at which point the benchmark begins to plot? And why does this beginning influence the outcome of the plot in the first place? That's not right!
So how to reproduce the problem? I can zip both the IQFeed and Yahoo data files for SPY and send them to you if you like. But I don't think you're going to be able to reproduce this plotting problem without those files unless you already know why the plotting routines fail because of weird behavior at the beginning of the SPY TimeSeries. Could the plotting routines be trying to vertical-autorange the plot based on too few points at the beginning? Perhaps the benchmark is being plotted with a much more compressed range than the equity plot.
In any case, if you "think" you fixed the plotting problem, you're not going to be able to verify that unless you can reproduce this problem at your end in the first place.
Here’s a theory, do you have the Backtest Settings option Use Margin Settings for Benchmark enabled? If so, then with no margin (1.0 Margin) it’s likely the buy and hold simulation did not have enough equity to enter its position because the market gapped up from the basis bar to the entry bar. We can fix this for Build 28 by giving the benchmark simulation a small margin even if that option is selected.
It doesn't look like "Use Margin in Benchmark Backtest" is enabled, see screenshot.
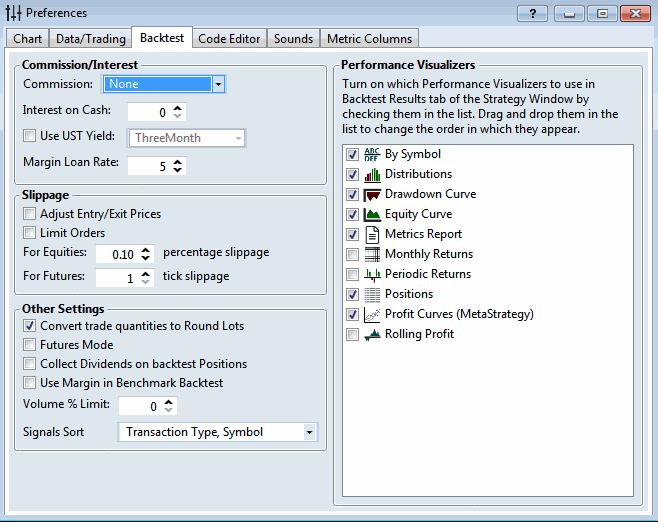
But this does raise the question, "Why isn't everyone else seeing this problem?" Of course, I use a Data Range of 800 daily bars (which most people don't use). And my StartIndex is different than everyone else. Or perhaps users are seeing this problem, but just not reporting it.
Is there a way you can detect when the benchmark plot flat lines? If so, then when that condition is detected, can you have WL7 write out some benchmark plot state variables to the WL7 Log Viewer? I'm happy to email those Log Viewer logs to you so you can study which state variables go rogue.
Simply writing the "would be" benchmark TimeSeries to disk might be useful. Or I could look at it with the VS debugger, although I haven't used that debugger with WL7 yet. Are there directions prepared for WL7 debugging?
Try turning off round lots, I bet that’s the issue! We need to disable that for the benchmark simulation.
QUOTE:
Try turning off round lots, I bet that’s the issue!
Success! When I turn off "round lots," the benchmark flat lining problem disappears. And when I turn round lots back on again, the flat lining problem returns. This side effect should be documented better on the GUI panel.
Please explain why "round lots" does not cause a problem with the WL Sample Strategies? And what does the value of StartIndex have to do with anything?
It’s causing the number of shares in the benchmark simulation to get rounded up or down to the nearest hundred. if it happens to get rounded up, there are times when it doesn’t have enough capital to take its position. StartIndex affects the bar number that the benchmark simulation begins at.
We’re going to change this behavior in the next build to eliminate the issue. The benchmark simulation will ignore round lots.
We’re going to change this behavior in the next build to eliminate the issue. The benchmark simulation will ignore round lots.
Your Response
Post
Edit Post
Login is required