Somebody using this extension and want to share his experience with the correlation optimizations visualizer?
Rename
> You can remove this topic.
This would be a pitty....
I do not understand why nobody is willing to share his experience.
The correlation visualizer, together with the parameter importance visualizer are very valuable tools when it comes to strategy development.
The scenario
You are in the process of developing a trading strategy with WL8. From time to time you add a new parameter (Period, Limit, Percentage, and so forth).
Because it is not very obvious what a good value would be for such a new parameter you add it to the list of optimizable parameters and use the optimizer to find an "interesting range" of working parameter values.
After some time you have a respectable number (say 5 to 15) optimizable parameters.
This is both, good and bad. It is good, because it makes your strategy development very flexible, you have a lot of screws to adjust its behavior.
It is also bad because the overall complexity rises (which is generally a bad thing) and the risk of overoptimization grows also.
Now it is time to remove some parameters from the set of optimizable parameters and assign a fixed "working" value to these parameters.
Of course the golden question comes up: Which of these parameters are ready for a fixed value?
The answer comes from two visualizers:
1. Parameter Importance
2. Correlations
Parameter Importance
Here is the Parameter Importance Visualizer for a variation of the infamous Knife Juggler strategy instrumented with seven optimizable parameters:
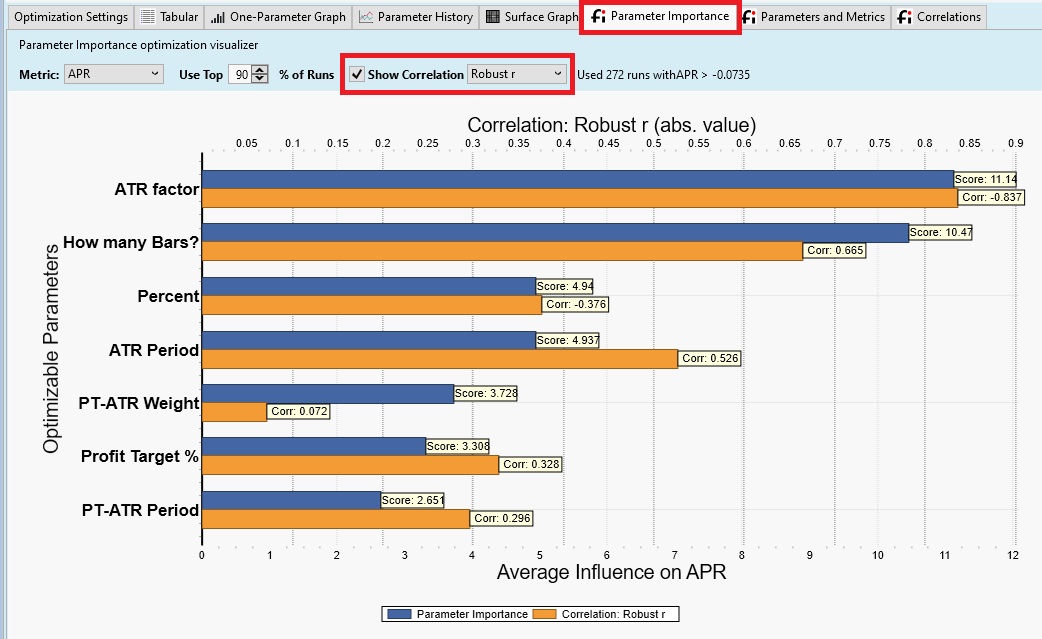
I activated the "Show Correlation" checkbox, which results in two sets of importance values. The blue bars are calculated by a proprietary algorithm, the orange bars are based on (robust) correlations between parameter values and a target metric (here APR).
It is obvious form this graph, that the parameters "ATR factor" and "How many Bars" are the most important parameters for this strategy.
The Parameters "PT-ATR Weight", "Profit Target %" and "PT_ATR Pariod" are less important and good candidates to be replaced by some fixed value.
Correlations
The Correlations Visualizer shows more details, for example about the relation between a parameter (here ATR factor) and the target metric (APR in this case):
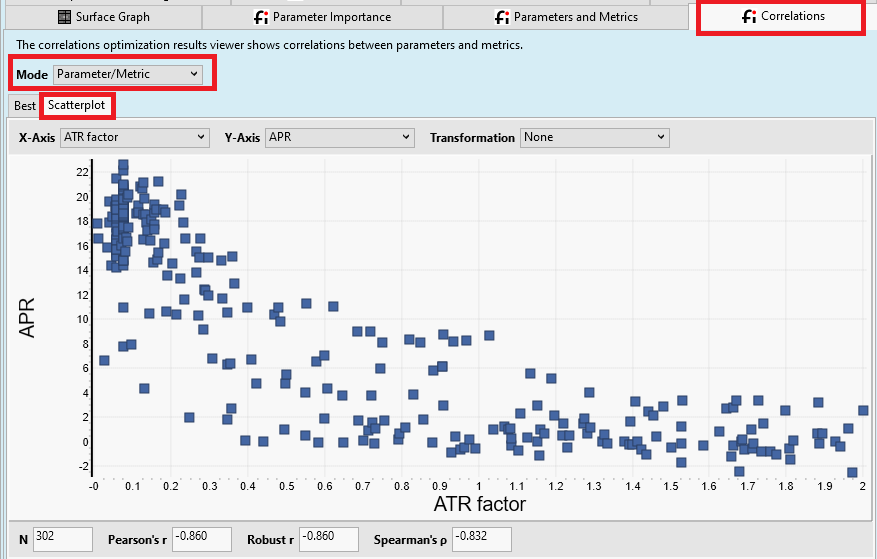
The scatterplot shows a nice and relatively strong correlation between
"ATR factor" and "APR". It is rare to see such strong correlation when developing a trading strategy, so you will keep this parameter in your strategy for sure.
I hope this explanation makes clear, that these visualizers are valuable tools for the development of a trading strategy.
Please share your thoughts!
This would be a pitty....
I do not understand why nobody is willing to share his experience.
The correlation visualizer, together with the parameter importance visualizer are very valuable tools when it comes to strategy development.
The scenario
You are in the process of developing a trading strategy with WL8. From time to time you add a new parameter (Period, Limit, Percentage, and so forth).
Because it is not very obvious what a good value would be for such a new parameter you add it to the list of optimizable parameters and use the optimizer to find an "interesting range" of working parameter values.
After some time you have a respectable number (say 5 to 15) optimizable parameters.
This is both, good and bad. It is good, because it makes your strategy development very flexible, you have a lot of screws to adjust its behavior.
It is also bad because the overall complexity rises (which is generally a bad thing) and the risk of overoptimization grows also.
Now it is time to remove some parameters from the set of optimizable parameters and assign a fixed "working" value to these parameters.
Of course the golden question comes up: Which of these parameters are ready for a fixed value?
The answer comes from two visualizers:
1. Parameter Importance
2. Correlations
Parameter Importance
Here is the Parameter Importance Visualizer for a variation of the infamous Knife Juggler strategy instrumented with seven optimizable parameters:
I activated the "Show Correlation" checkbox, which results in two sets of importance values. The blue bars are calculated by a proprietary algorithm, the orange bars are based on (robust) correlations between parameter values and a target metric (here APR).
It is obvious form this graph, that the parameters "ATR factor" and "How many Bars" are the most important parameters for this strategy.
The Parameters "PT-ATR Weight", "Profit Target %" and "PT_ATR Pariod" are less important and good candidates to be replaced by some fixed value.
Correlations
The Correlations Visualizer shows more details, for example about the relation between a parameter (here ATR factor) and the target metric (APR in this case):
The scatterplot shows a nice and relatively strong correlation between
"ATR factor" and "APR". It is rare to see such strong correlation when developing a trading strategy, so you will keep this parameter in your strategy for sure.
I hope this explanation makes clear, that these visualizers are valuable tools for the development of a trading strategy.
Please share your thoughts!
Thank you for that explanation. Part of the reason I haven't looked at these statistics much is because they were never explained. Now I'll take a second look at them.
Typically, I'm concerned about parameters that have a high variation between different stocks. Those are the ones I code as strategy parameters. But I like your method of employing correlation between a metric targeted for optimization (say APR or profit) and a strategy parameter better. The problem is this correlation is not always very linear or clear, but when it is, then I like this approach better.
Stock behavior is constantly changing, so "attempting" to solve (optimize) for some strategy parameter that's held constant over the past five years isn't ideal in many cases. The better solution is to pick "modern" indicators that are adaptive over the year so they follow the stock behavior better. Go ahead and learn technical analysis with the older, prototype indicators (which aren't adaptive), but code your production strategy with their modern, adaptive counterparts.
I would also favor picking modern indicators that take a BarHistory (both price and volume) as input over a TimeSeries (price alone) because both price and volume matter to your trading model. Happy modeling.
What's the maximum score or do i have to see it in relation with others scores?
11 could be low but in relation to 4 it's high.
11 could be low but in relation to 4 it's high.
Also thanks for the explanation of this visualizer.
Could you perhaps still explain the tab "Correlations" a little bit, so that one understands the connections of the numbers?
Because I have with interpretation of the numbers probleme.
Which value is good now and which is less.
Thank you!
Could you perhaps still explain the tab "Correlations" a little bit, so that one understands the connections of the numbers?
Because I have with interpretation of the numbers probleme.
Which value is good now and which is less.
Thank you!
Your Response
Post
Edit Post
Login is required