New community highlight!
One of our users just ran a super clean backtest of the CNN Fear & Greed Index using WealthLab — and the results were *way* more interesting than expected.
Worth a read if you’re into sentiment signals or regime testing:
https://backtest.substack.com/p/i-backtested-the-cnn-fear-and-greed
Curious what you all think… does this indicator actually have a place in a strategy?
Rename
As far as I understand, the whole strategy consists of buying when the F/G value falls within a certain range and then waiting for a set number of days. Either I coded it incorrectly, or something else is off, because my results are significantly worse than the benchmark.
However, when I was googling, I came across a similar strategy published by a WL user also, possibly by the same https://www.reddit.com/r/StockMarket/comments/1f6fjyn/cnn_fear_greed_index_at_a_closing_50_day_high_a/
However, when I was googling, I came across a similar strategy published by a WL user also, possibly by the same https://www.reddit.com/r/StockMarket/comments/1f6fjyn/cnn_fear_greed_index_at_a_closing_50_day_high_a/
That other post is me as well. The 50 day high one.
In response to ww5. What you're missing is that it's not falling into that range. Run an optimization for each decile and then have the individual holding periods. If it closes between 30 to 50 and I hold for 5 days etc. I loaded the optimization file to the discord. We are not actually optimizing anything we just want to see all the trades for all the holding periods and decile ranges.
I'd like to explore this, but I haven't been able to locate the complete historical data for the Fear and Greed index. Where did you find it?
QUOTE:
locate the complete historical data for the Fear and Greed index
You need to first install the WL PowerPack extension. It's an indicator in the PowerPack folder called CNNFearGreed.
Have fun.
That's interesting, but I wonder what would happen, if they would test the short side (falling markets)?
A small question, when I load this indicator, there is a period of values showing 65 in 24, which seems to be incorrect. Has anyone else encountered the same situation, or how can I refresh the values of this indicator?
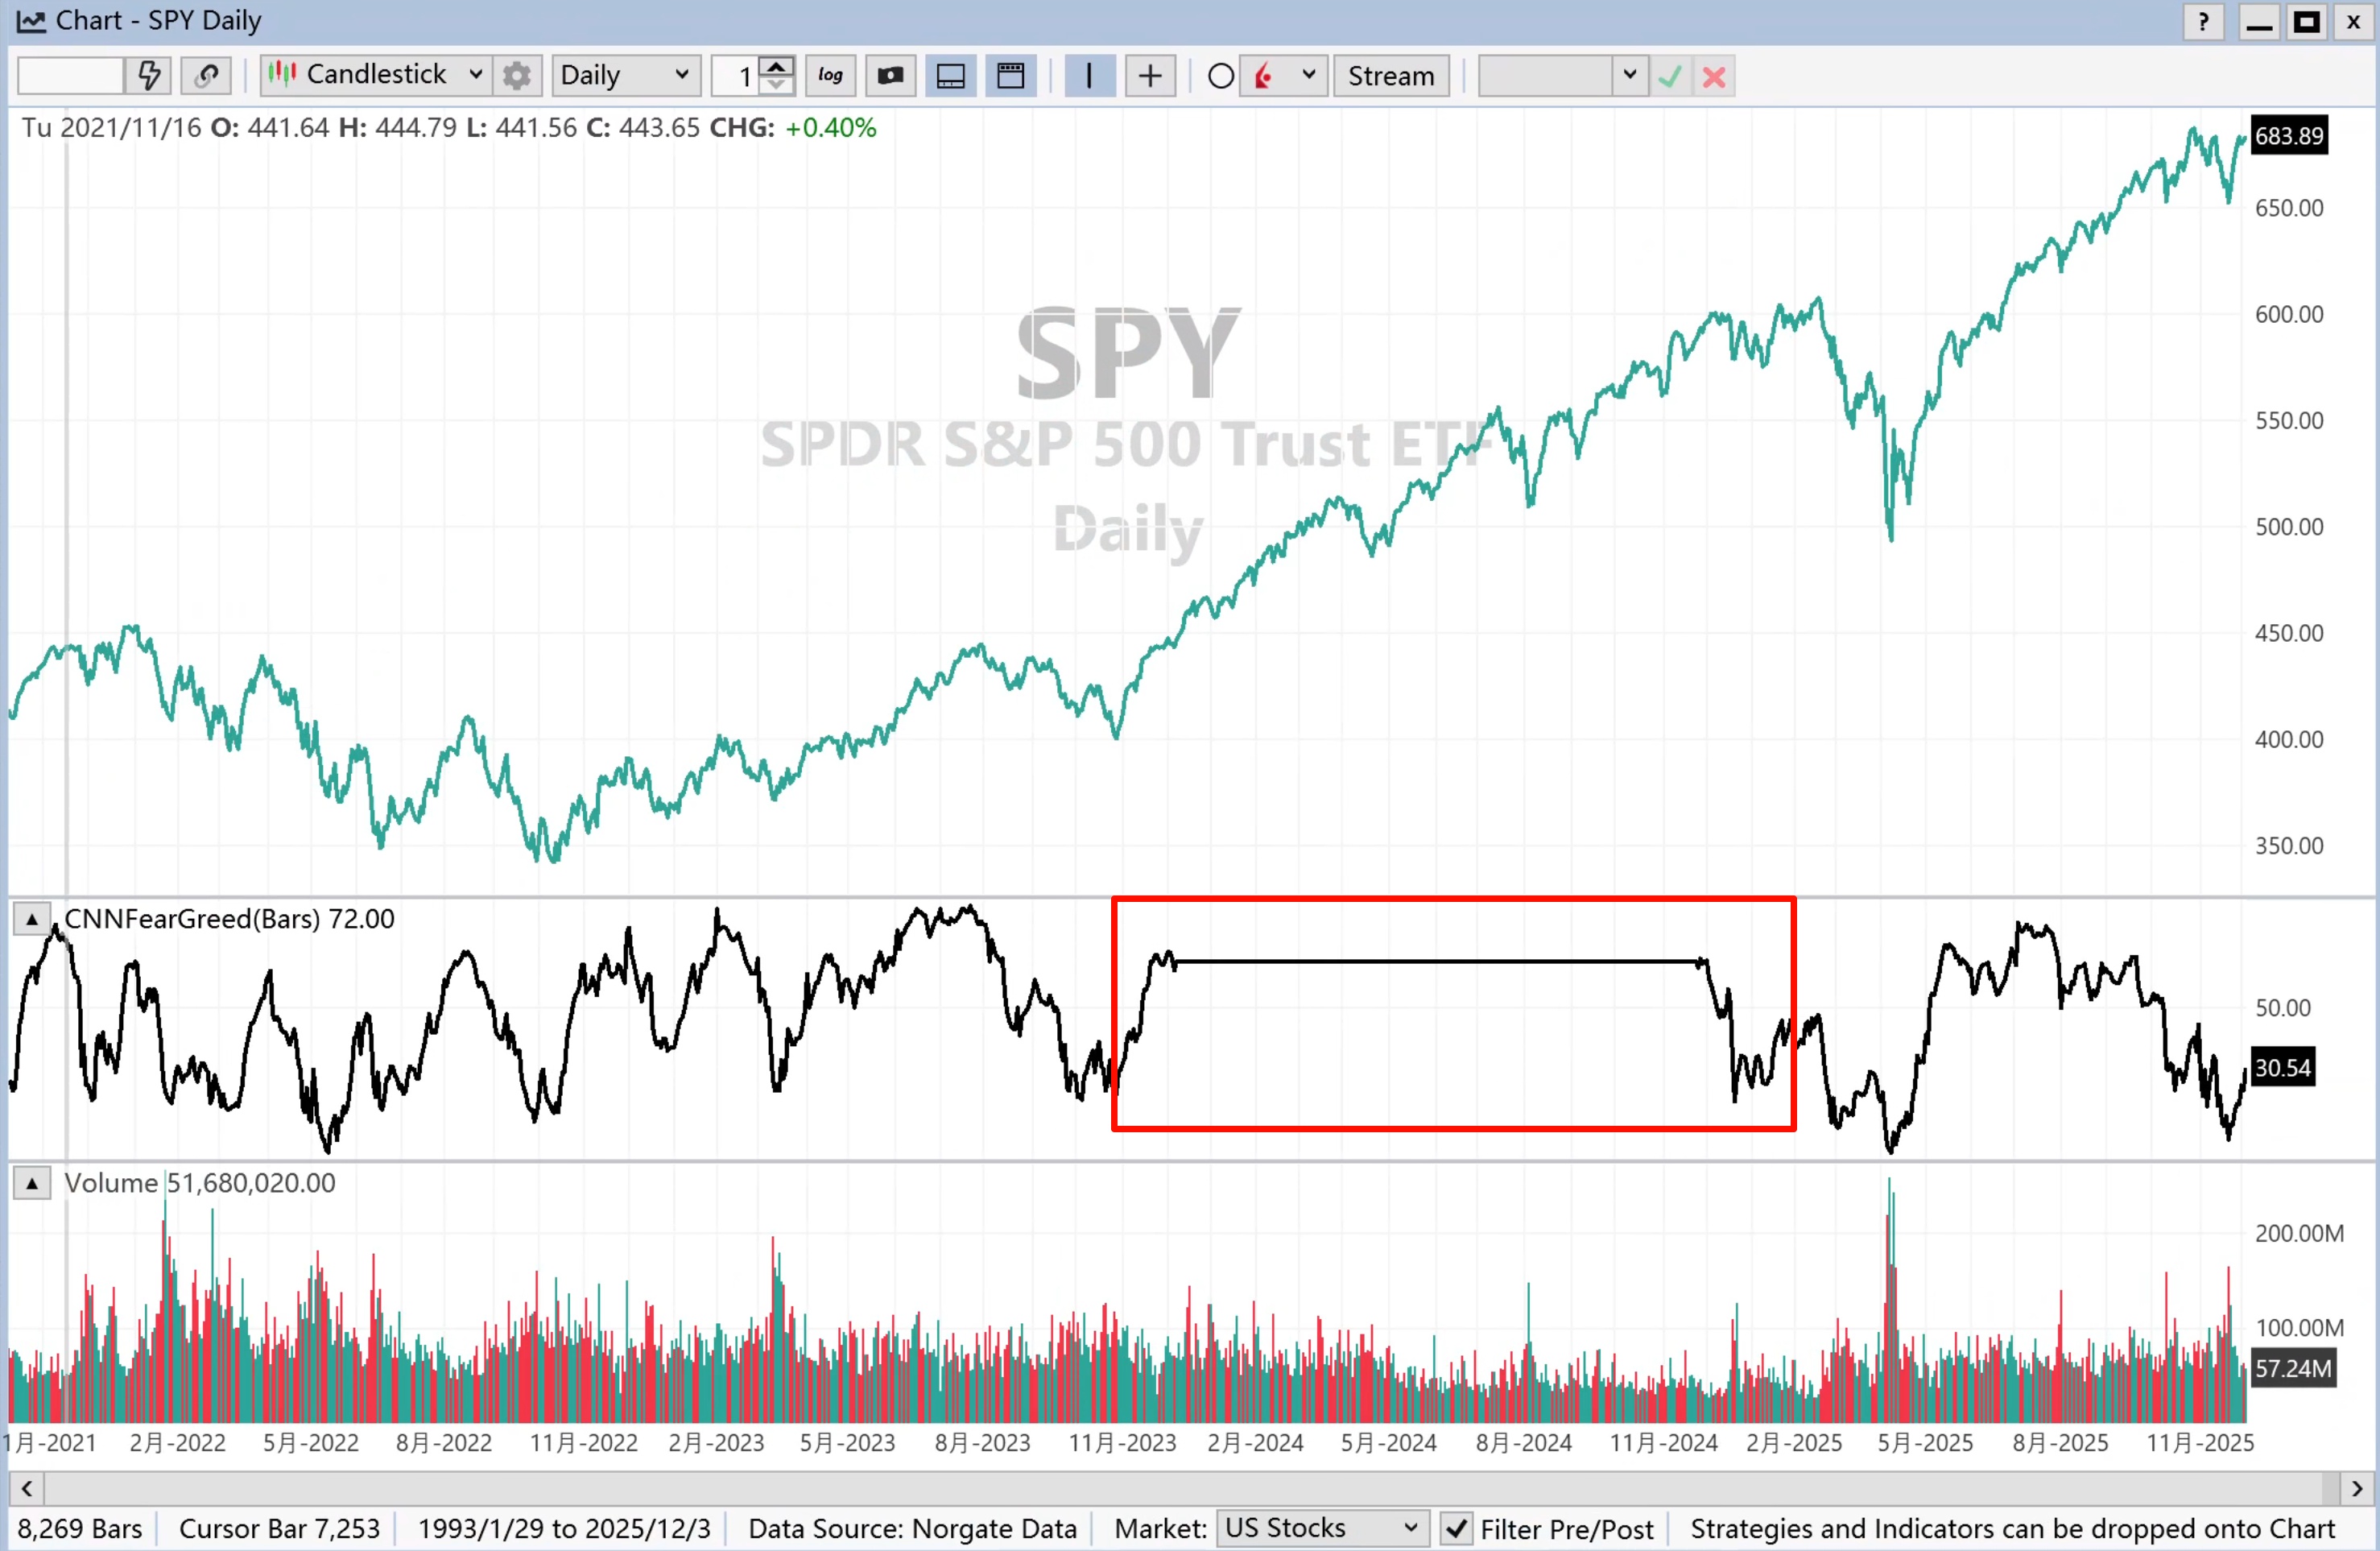
I don't see the data cache problem shown in Post #7. You need to "probably" delete the CNNFearGreed.QXI file in your Wealth-Lab User Data Folder. From the File menu, you can locate that folder. However, you must quit WL before deleting that cache file.
If WL quits (or freezes) unexpectedly (Did you have a power failure?), these files can get truncated or corrupted.
If WL quits (or freezes) unexpectedly (Did you have a power failure?), these files can get truncated or corrupted.
I see the same on one computer, and deleting/refreshing does not help. It seems this is in the file loaded with the PowerPack. (I think the issue is that PowerPack has the data cached up to about 12/7/2023, but the update from CNN is available only for the last 1 year.)
On another machine I have a smaller range of missing data in the first half of 2024.
If someone has a complete file, please post it (google drive).
On another machine I have a smaller range of missing data in the first half of 2024.
If someone has a complete file, please post it (google drive).
I’ll get Power Packs cache updated!
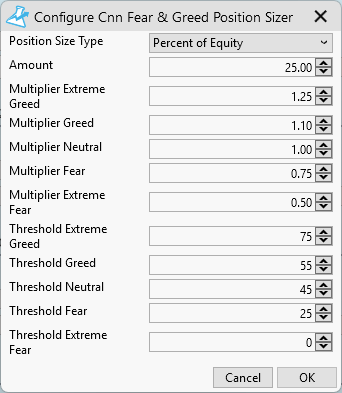
Have you ever considered offering an adaptive position sizer based on market sentiment?
Such a position sizer should use the 5 days smoothed CNN Fear & Greed Index to dynamically adjust position size to the psychological market conditions.
– High values (greed) → Position size is gradually increased.
– Low values (fear) → Position size is defensively reduced.
This results in flexible money management that acts more aggressively in strong market phases and more cautiously in uncertain phases.
Goal: Smoothing risk, improving the risk/reward ratio and adaptive capital allocation instead of static percentage targets.
I thought of something similar using VIX but this is an interesting idea.
Could this be generalized to be something that could take any series and a list of thresholds and multipliers? Both above (VIX, Fear & Greed) fit into this.
@Glitch
The VIX alone isn't very useful; I would combine it with the SKEW and build a traffic light system.
VIX measures expected volatility in the next 30 days (systemic stress / trend risk). SKEW measures tail-risk pricing (crash probability). Together they form a dual-axis regime model: trend risk + crash risk.
🟢 1. Green Regime – Stable Bull Market (Risk-On)
VIX < 15 and SKEW 120–135
Meaning
Market expects stable upward movement.
Low demand for downside protection.
Ideal conditions for trend continuation.
Signal
→ Long bias, normal or increased risk allocation
→ Trend and momentum strategies perform best.
🟡 2. Yellow Regime – Hidden Risk / Blow-Off Potential
VIX < 15 and SKEW > 145–150
Meaning
Market appears calm, but institutional players buy heavy OTM put protection.
Signals concealed structural risk.
Signal
→ Caution
→ Hold positions but avoid aggressive additions
→ Tighten stops
→ Consider hedging exposure
🟠 3. Orange Regime – High Stress, High Volatility (Rebound Environment)
VIX 20–30 and SKEW < 125
Meaning
Market is nervous, volatility elevated.
But there is no strong demand for crash insurance → no structural breakdown.
Typical for oversold conditions and sharp reversals.
Signal
→ High rebound probability
→ Ideal for mean-reversion trades and short-covering setups
🔴 4. Red Regime – Systemic Risk / Crash Setup
VIX > 25–30 and SKEW > 145–150
Meaning
Volatility is rising and tail-risk is being priced aggressively.
Hedge-funds secure both short-term and deep downside.
Rare but serious → can precede disorderly declines.
Signal
→ Risk-Off
→ Reduce exposure
→ Raise cash
→ Activate hedges
🔵 5. Blue Regime – Post-Stress Relaxation (Pro-Rebound Phase)
VIX drops from >25 back under 20 and SKEW rises back above 130
Meaning
Market stress is reducing but caution remains moderate.
Often marks the start of new upward cycles after a correction.
Signal
→ Aggressive rebound opportunity
→ Attractive entry zones after volatility spikes
We have SKEW available in the CBOE Provider, have you coded this into a Position Sizer yet or should I give it a go?
Thinking more, I thing this regime model would be interesting if expressed as a Data Extensions indicator, let me create that and we can then take the next step(s) if it looks like it would be worthwhile.
Thinking more, I thing this regime model would be interesting if expressed as a Data Extensions indicator, let me create that and we can then take the next step(s) if it looks like it would be worthwhile.
I started this at the beginning of 2024, but never finished it. Here's my skeleton code from that time.
CODE:

using WealthLab.Backtest;
using WealthLab.Core;

public class VixSkewRegimeStrategy : UserStrategyBase
{
   private BarHistory vixBars;
   private BarHistory skewBars;
   private TimeSeries regimeSeries;

   private const string VixSymbol = "^VIX";
   private const string SkewSymbol = "^SKEW";

   public override void Initialize(BarHistory bars)
   {
      vixBars = GetHistory(bars, VixSymbol);
      skewBars = GetHistory(bars, SkewSymbol);

      regimeSeries = new TimeSeries(bars.DateTimes);

      for (int bar = 1; bar < bars.Count; bar++)
      {
         if (double.IsNaN(vixBars.Close[bar]) || double.IsNaN(skewBars.Close[bar]))
         {
            regimeSeries[bar] = (int)MarketRegime.Neutral;
            continue;
         }

         double vixToday = vixBars.Close[bar];
         double skewToday = skewBars.Close[bar];
         double vixPrev = vixBars.Close[bar - 1];
         double skewPrev = skewBars.Close[bar - 1];

         MarketRegime regime = GetVixSkewRegime(vixToday, skewToday, vixPrev, skewPrev);
         regimeSeries[bar] = (int)regime;
      }
      PlotTimeSeries(regimeSeries, "Regime", "Regime", WLColor.Blue, PlotStyle.Line);
   }

   public override void Execute(BarHistory bars, int bar)
   {
      MarketRegime regime = (MarketRegime)regimeSeries[bar];

      bool isRiskOn = regime == MarketRegime.Green || regime == MarketRegime.Blue;
      bool isRiskOff = regime == MarketRegime.Red || regime == MarketRegime.Yellow;

   }

   private MarketRegime GetVixSkewRegime(double vixToday, double skewToday, double vixPrev, double skewPrev)
   {
      if (vixPrev > 25 && vixToday < 20 && skewToday > 130)
         return MarketRegime.Blue;

      if (vixToday < 15 && skewToday >= 120 && skewToday <= 135)
         return MarketRegime.Green;

      if (vixToday < 15 && skewToday >= 145)
         return MarketRegime.Yellow;

      if (vixToday >= 20 && vixToday <= 30 && skewToday < 125)
         return MarketRegime.Orange;

      if (vixToday > 25 && skewToday >= 145)
         return MarketRegime.Red;

      return MarketRegime.Neutral;
   }

   public enum MarketRegime
   {
      Neutral = 0,
      Green = 1,
      Yellow = 2,
      Orange = 3,
      Red = 4,
      Blue = 5
   }
}
You may want to look at the MOVE Index as an alternative to VIX. It measures volatility in the Treasury bond market. Notably, it reacts quickly to changes in the critical Treasury repo market. What happens there affects everything in the financial system, with a global impact, because of the Eurodollar system.
I haven't done a Granger Causality test of changes in MOVE and changes in VIX. My strong suspicion is that the direction of causation is from MOVE to VIX.
At some point, I would like to incorporate MOVE into a position sizing method.
I haven't done a Granger Causality test of changes in MOVE and changes in VIX. My strong suspicion is that the direction of causation is from MOVE to VIX.
At some point, I would like to incorporate MOVE into a position sizing method.
QUOTE:
You may want to look at the MOVE Index as an alternative to VIX.
Incorporating MOVE is highly beneficial because:
- it allows to identify macro stress before it impacts stock prices
- it allows to better time rebounds
- it allows to identify crash risk even more reliably
- it allows to reach an institutional level
- the model becomes more complete and provides earlier warnings
Your Response
Post
Edit Post
Login is required