A Golden Easter Egg
Mar 08, 2022 by vk
Easter Seasonal Trading
Seasonal trading seems to often offer good trading opportunities. In this brief article I'd like to investigate the truth behind the rumors by using pure numbers and facts. Will buying and selling around Good Friday produce abnormal returns?
I am about to analyze the historical performance of buying the S&P 500 Index x days before the holiday and selling y days following Easter. The parameters x and y, 1 and 0 by default, respectively, are our optimization parameters, while the optimization target will be Profit Per Bar. Using daily closing prices of the S&P 500 Index from 1992 until 2021 (that is 30 events, one each year), here is what I will do:
- Compare results to historical average daily percent return for all trading days in the sample
- Perform some parameter stability testing (PST)
- Show you the results of the Walk-Forward-Optimization results applied to the Out of Sample periods. In my opinion, there is no better way to get more realistic results.
Let’s look at the last trade from 2021:

This transaction logged a profit of 1.04% in just one trading day. Buy at the open before Good Friday and sell at the open of the first trading session.
From the 30 trades 21 were winners, that is 70%.
Easter Rules!
Using the default parameter values, the average percent profit of all trades was 0.41%, while the average percent profit per trading day in the S&P Index during the entire testing period was 0.12%.
A trader following the Easter rule would have cashed in with a 3.4 times higher return than the average trading day.
The standard optimization run showed that the first picked rule produced the best result in Percent Profit Per Bar, where a Bar is 1 trading session. Here some metrics from the simple optimization:

The walk forward test showed some interesting results. I am using the expanding window which I prefer the sliding window.
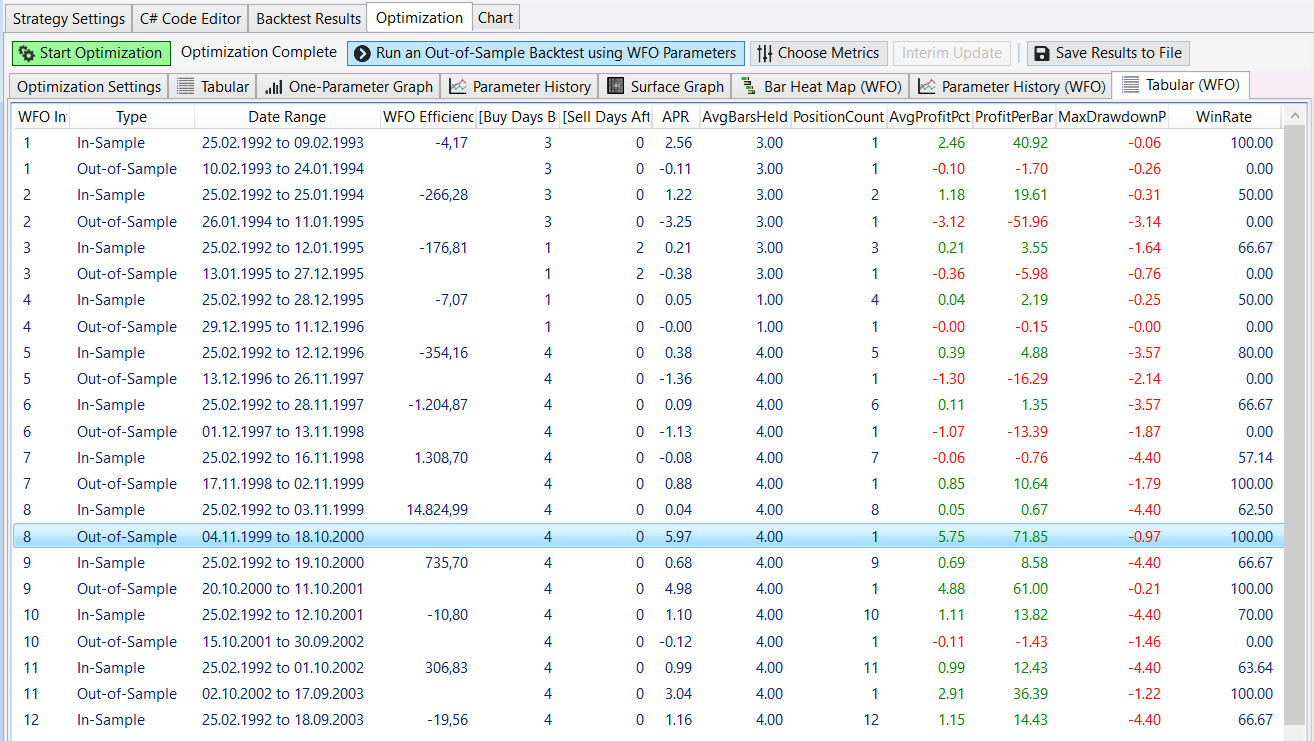
One of the really amazing features is that you can apply the Out Of Sample (OOS) results into your backtesting with just one click of the mouse.
And that the OOS results were applied to the respective trades shows up here in the “Bars Held” column.

Conclusion
This is just a simple approach, but it shows some promising results. I could think of many different variations, like using some filters like:
- S&P 500 is above/below a certain SMA
- S&P 500 is oversold using the RSI
- Apply the rule to individual stocks (most oversold or in an uptrend)
Applying the same rule to different indices also showed some good results. Check it out on the DAX for example.