I would like to plot colored Bollinger Bands, like this:
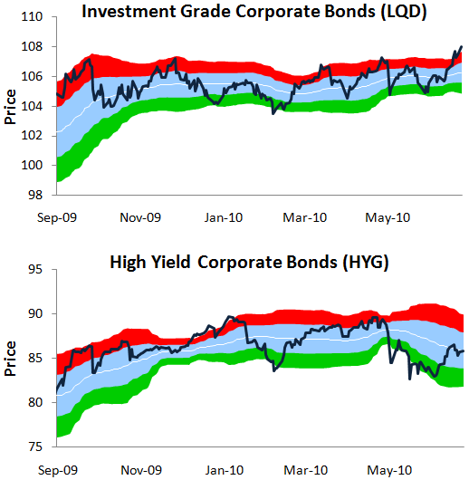
How?
Size:
Color:
Start by checking out PlotSeriesFillBand and PlotSeriesDualFillBand in the QuickRef.
Size:
Color:
Got it.
CODE:
Please log in to see this code.
Still haven't learnt how to plot prices as a thick line, though.
Size:
Color:
1. Switch to Line chart style, and hit Ctrl-Y to bring up the config dialog.
2. Or you could plot prices with any line style active by using PlotSeries.
Size:
Color:
1. Don't want to alter my default chart style so I'd rather control the plot from inside the script.
2.
CODE:
Please log in to see this code.
Problem is, this gets plotted over the underlying chart style (candlesticks); how do I get rid of those?
Size:
Color:
For all practical purposes, switch to Line chart style since you already want to get rid of the OHLC.
Size:
Color: