Hi Eugene,
Is it possible to have a visualizer like Profit by Month but with days of the week ? When you are an intraday or swing trader, this view is more appreciate.
Size:
Color:
You can select Daily in the "By Period" Visualizer (valid for Portfolio Simulation mode sizing only).
Size:
Color:
That's not exactly what Alexandre is looking for i.e. to find out if there's a tendency for particular day of week to be profitable or losing.
Enhancing the
Profit By Month visualizer is an interesting idea, I'll mark to investigate into this matter.
Size:
Color:
Okay, but in the meantime it's pretty easy to copy the data to a spreadsheet and use a Pivot table to summarize the data by Day of Week.
Size:
Color:
Thanks Eugene. You have understood exactly what I would like.
It could be interesting if you can add also a filter to see the result by entry bar, by exit bar or like today without any filter.
Size:
Color:
Hi Eugene,
I have seen in another lab package, two features that wwe don't have in our visualizer :
- possibility to focus on a type of trade (short, long or both)
- possibility to see result for opening trade vs closing trade
In addition to this, the visualizer gives to the intraday trader the possibility to see the result by time of day.
You can see the screen shot of the visualizer here :
https://www.qtlab.ch/images/StrategyLAB/Stagionalita%20OpenClose.PNGIs it possible to add theses features ?
Size:
Color:
Hi Alexandre,
QUOTE:
- possibility to see result for opening trade vs closing trade
If by "opening/closing trade" you mean "entry/exit signal" then the
Contribution pie chart already lets you break the performance results down by entry / exit signal, calendar month etc.
QUOTE:
- possibility to focus on a type of trade (short, long or both)
Thank you for your suggestion. I think it's a good idea to add a new option "By position type" (Long/Short) to the Contribution tab. Look forward to it in v2019.07 of MS123 Visualizers (ETA end of June).
Since your post is found in a Trade Graphs thread I guess you wanted me to add this to said visualizer. Looked into it and unfortunately it doesn't appear feasible. As breakdown by position type was not a part of the initial requirements for Profit By Month/DayOfWeek, introducing it there would lead to reduced code quality and overload of its GUI with less useful options.
QUOTE:
In addition to this, the visualizer gives to the intraday trader the possibility to see the result by time of day.
Sorry, this is not considered.
Size:
Color:
Yes, when I said Opening / Closing trades, it was the same things as Entry/Exit date.
For me, the contribution and the Profit by Month (or Days of week) have not the same objective.
In one hand, the contribution must help you to detect if your trading result are almost equal at any configuration (or if you have a predominate result which gives you most of your performance and means your trading strategy is probably not so good). In others hand, the Profit By Month (or days of week) will help you to detect if there is a seasonality in your result (and help you to eliminate worst time frame periods).
And the problem is that the seasonality can be different if your are long or short and if you take into account the entry date or the exit date depending of the trade duration (of your trading strategy logic).
Size:
Color:
Suggestion: break your strategy in two: long and short. After saving them as two distinct strategies you could analyze their seasonality separately. It is much easier for you to accomplish than considering a really involved change for the Profit By... tabs which I do not plan to do.
Size:
Color:
Ok. No problem. I understand. But what's about the Entry/Exit option ? This will really boost the possibility of study for the Profit By ... ?
Size:
Color:
Still the same. Filtering the results by any Position property is not considered in these visualizers. Sorry.
Size:
Color:
Ok Eugene. But what's about the possibility to add two new bars (one with the result by entry date and another with the exit date) in the same bar graph ? You have no filter to add to the visualizer by this way. You have just to manage 3 series.
Sorry to insist on this feature :-).
Size:
Color:
No problem Alexandre, I'll explain. The current logic happily operates on the Equity data series alone. It doesn't have to have any knowledge of required entry and exit dates which are Position object's properties. They would be extraneous to the otherwise robust and simple algorithm. The feature request would clearly add complexity to the logic, requiring a development, testing and support effort. And I'm not convinced at all that there might be considerable benefit. You know I appreciate (and implemented a lot of) your feature requests. Sorry to reject this one. :/
Size:
Color:
Size:
Color:
Alexandre, I've got some questions for you:
1. Re: "possibility to see result for opening trade vs closing trade". Having revisited the
other platform's screenshot I now think it plots the
number of entries/exits made in an interval. (Negative numbers on the chart indicate that there were more exits than entries.) Something like this is already available in the By Period and Trade Graphs charts. If you were after something else then could you clarify? How would you calculate what you have on your mind given that trades can and will span over multiple periods and sometimes last for years?
2. Liked the
Seasonality PDF, a good read. I think that to arrive at a chart like in the article it requires to note the prices (single symbol or for each symbol of a DataSet) at the beginning / end (or more likely the curve of day-to-day changes) of each period (say monthly) in a given data range (say 30 years), normalize and average them. Not really a performance visualizer but potentially an interesting analysis tool. But do you see room for the actual entries/exits of a system here??
3. Last but not least. How would you calculate the "possibility to focus on a type of trade (short, long or both)"? Don't hesitate to give me more detail, it's still unclear to me. (We're not talking about the Trade Graphs visualizer here, rather evaluating something new.)
Size:
Color:
Hi Eugene,
My original problem was to detect if my trading strategy has some specific periods of time with losing most of the time. If yes, the idea was to bypass them with a filter (or delay my order). Because of that, as my strategy can have different entry logic if you are long or short, I have requested to see the visualizer with the result for Long/Short and both. Except the last point, the current visualizer reply to this subject. And as you said previously, the simple way to manage long and short view is to run my strategy just with long and after just with short trades.
But after reading several articles about market seasonality, I had another problem : If I know that a specific period is most of the time losing, this is a good idea to add a filter in my trading strategy to bypass it (or to delay my signal to enter in the next good period). Atthis time, I made a confusion with the original idea of the visualizer and request you to add a view by entry/Exit date.
So, now, I understand why you were sceptic. :-). Moreover, after a deep look in the screen shot, I think you have right. This is a view of the balance between opening and closing trades. I'm agree with you that we have similar visualizer in WL.
If you see the potential about the possibility to have a seasonality detection tool, the formula logic of the chart in the PDF document can be find here :
https://www.seasonalcharts.com/FAQ.html#pos02. I agree with you that entries/exits of a system don't make sense here.
For your information, a more developed approach can be find in the same Italian lab software. See the screen shot here :
https://www.qtlab.ch/images/StrategyLAB/StrategyLAB%201Seasonal1.PNG and
https://www.qtlab.ch/images/StrategyLAB/StrategyLAB%201Seasonal2.PNG and
https://www.qtlab.ch/images/StrategyLAB/StrategyLAB%201Bias%20DoW.PNG and
https://www.qtlab.ch/images/StrategyLAB/seasonal%20and%20stdev.png. Is it something that you have in mind ?
On this case, I don't see any link with long and short trade.
Size:
Color:
Thanks for the information, I put Seasonality visualizer on our backlog for later review (H2'19). btw: found other, different sources to seasonal charts so this kind of chart doesn't appear to be copyrighted. Good.
P.S. Offtopic:
QUOTE:
And as you said previously, the simple way to manage long and short view is to run my strategy just with long and after just with short trades.
Just to add, the simplest way to do it is the
Position Options PosSizer's option "Take (all | long | short) positions". It doesn't require you to change the Strategy code. Just a matter of making a choice in the dropdown box.
Size:
Color:
Thank you very much
Size:
Color:
@abegy
Alexandre, now you can find a breakdown of profit (or loss - depending on system's overall profitability) on the Contribution tab as of MS123 Visualizers v2019.07.
Size:
Color:
It's not clear yet what form the seasonality analysis discussed above would take: a new visualizer or something else. I'll think it over later (H2'2019).
Coincidentally, soon we'll put a spotlight on an interesting seasonality trading system. The Strategy code comes with a technique of visualization of seasonal patterns. Look for it ~ end of July.
Size:
Color:
Thank you Eugene for the news. Do not hesitate to come back to me if you want to share your reflection ;-)
Size:
Color:
QUOTE:
Coincidentally, soon we'll put a spotlight on an interesting seasonality trading system. The Strategy code comes with a technique of visualization of seasonal patterns. Look for it ~ end of July.
Just an update on the seasonal Strategy (no visualizer yet):
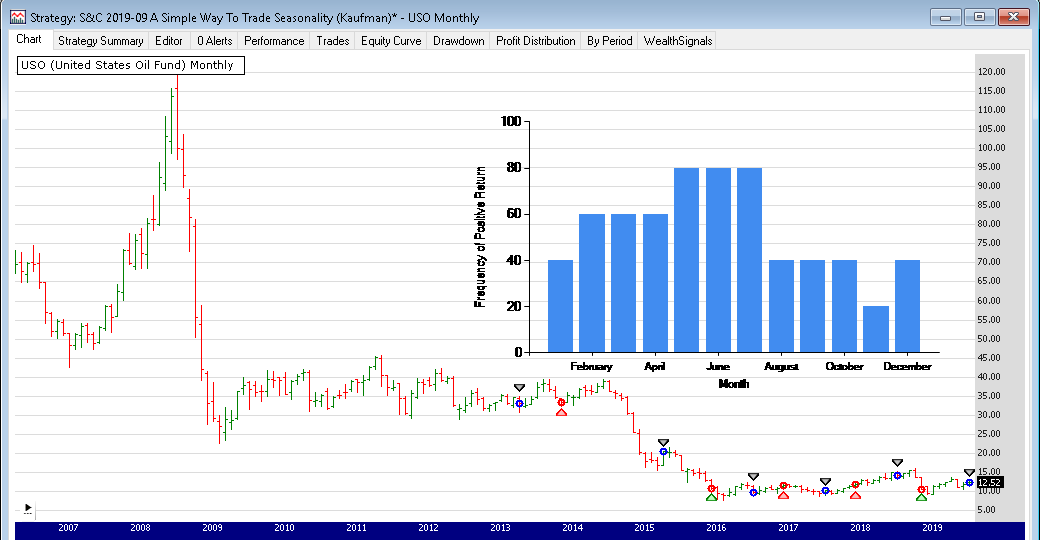
TASC 2019-09 | A Simple Way To Trade Seasonality (Kaufman) in the Wiki
Size:
Color:
Size:
Color:
Thanks for the information. It's a pity I no longer speak/write Italiano (still do in 3 other languages though) but had no big difficulty understanding the article. By the way, in the fragment where he talks about the monthly trends in Crude Oil he comes to a similar conclusion as in our Traders' Tips for which I picked USO ETF (that has strong positive correlation with the oil pirce):
QUOTE:
Si distingue piuttosto bene una tendenza a salire nei mesi di Febbraio, Marzo ed Aprile: la linea nera sul grafico traccia cosa è successo quest'anno.
Although Perry Kaufman's trading system intentionally doesn't consider negative returns, comparing the screenshot in post #26 above to
this or
that one indicates they're on the same page (with regard to the positive returns in the first half of year). The monthly seasonal Strategy is tradable so you have something to play/work with!
Size:
Color:
I've uploaded a new seasonal Strategy:
Months with biggest gain and lossIt's like "Sell in May and go away" except that the month is determined on a rolling basis for every symbol in the backtest. Check out its description for more detail and trading rules. Includes a histogram plot of the average monthly return % (last N years):
 Alexandre
, I think the recent enhancements and published strategy code covers the most part of your requests. The seasonal charts from
Dimitri Speck's article is a nice eye candy but it doesn't fit a Performance Visualizer. Neither a ChartStyle would be very practical. I'm reluctant to dedicate any effort to its development now that you have the two downloadable Strategies that lay out a framework for the seasonal trading on monthly data. With these examples you now have the technique to create dynamic seasonal systems and filters based on best/worth months and/or frequency of positive/negative returns!
IMHO the only missing piece is the
Hour of Day bias chart. If there's some value in it we
may get there one fine day but it will not happen in the short term.
Size:
Color:
Hi Eugene,
For your information, in the Following french website (
https://www.abcbourse.com/graphes/eod.aspx?s=RNOp), the seasonnality study has been implemented as a chart style. Select "Graphes" and "Style des cours" box. In the list, select "Saisonnalité" and see the result.
Size:
Color:
Size:
Color:
If you integrate a Chartstyle "Seasonnality" like the website, the advantage that I see is a visual result linked to the timeframe that you have selected in your chart window. I see no problem to use it in a backtest strategy. The idea is to say for example : If "Seasonnality.value[Bar] > 50 then BuyAtMarket...". Of course, you need to have the possiblity to configure your ChartStyle with the lookback period and the price series.
Moreover, as you can put your equity on a Chart, you can use the ChartStype to see the seasonnality on this price series.
This is what I see if there is a ChartStyle for seasonnality.
Size:
Color:
QUOTE:
The idea is to say for example : If "Seasonnality.value[Bar] > 50 then BuyAtMarket..."
No idea what "Seasonnality" is on their chart but the two strategies above let you create
trading systems based on the frequency of positive returns and months with biggest gain/loss using a variable lookback. Plus a nice visual aid.
Size:
Color: