Eugene Hello
Please add intresting Scorecard
(( Number Trades which create new Equity High ) / ( Number All Trades ))*100
We see how many trade's create new Equity High.
If more trade's create new Equity High, Equity grows smoothly.
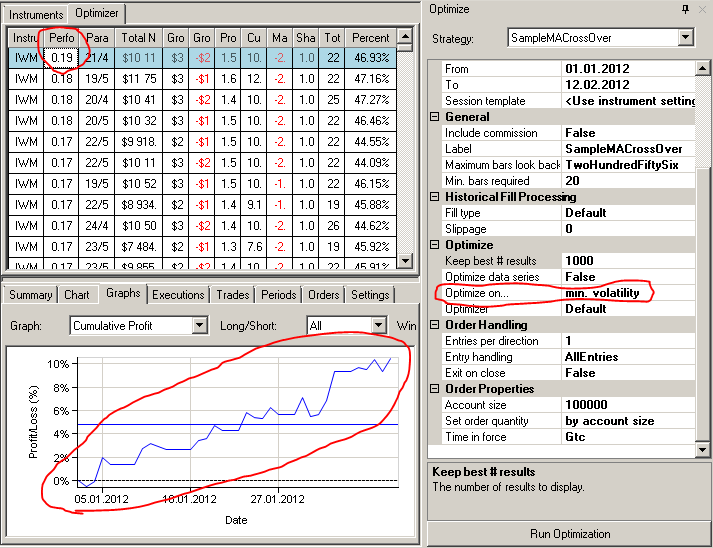
19% Trades Create New Equity High
[/URL]
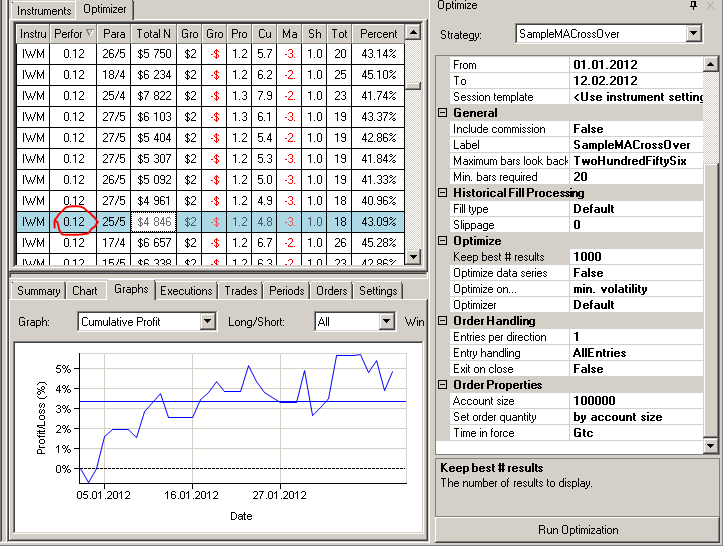
12% Trades Create New Equity High
[/URL]
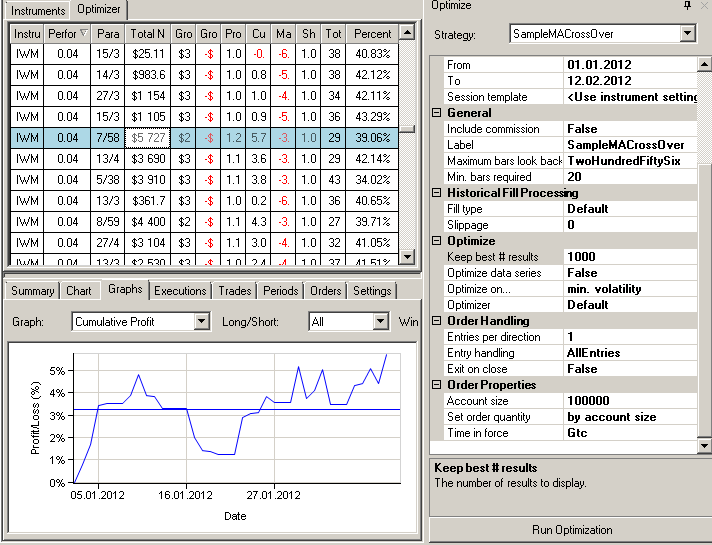
4% Trades Create New Equity High
[/URL]
Combination with this function ( X ) and other (Y)
[/URL]
Size:
Color:
License User who have WLD and test Strategy many Years, say this very intresting for Scorecard
I create this function for Ninja, I can not do for the WLD ( not good programmer )
Size:
Color:
This function have simple logic for understand.
We may have good Net Profit, Frofit Factor and other, but not have Equity grows smoothly, for fast find optimization parameters.
Size:
Color:
For example on Chart 3 we see Net Profit 5727$ but Equity not good
on Chart 2 we see Net Profit 4846$ Equity more good then Chart 3
Our function fast sort this optimization result and we know(see) that Chart 3 have only 4% trades which create new Equity High and Equity not good
Size:
Color:
QUOTE:
We may have good Net Profit, Frofit Factor and other, but not have Equity grows smoothly, for fast find optimization parameters.
Let me disagree on this. In MS123 Scorecard we already have
Lake ratio and K-Ratio which measure consistency of an equity's return over time, one way or another.
For example, Seykota's Lake Ratio was designed to estimate the ratio of time a system is spending setting new highs vs. sitting in drawdowns:

Size:
Color:
Ok I analysis Lake ratio and K-Ratio with this function what better
Thanks for additional information.
Size:
Color:
Eugene I see Basic Scorecard, Extended, MS123 in WLD x64, not found Lake ratio and K-Ratio ?
What need to install Extension ?
[/URL]
Size:
Color:
Tell me more about your idea. What's a "trade that sets a new equity high" in a multi-symbol portfolio backtest, precisely? Usually, when a new equity high is set, several open positions might satisfy that condition.
On a bar-by-bar basis I can imagine it, but with regard to the number of all trades, no. Explain it to me like you would to a eight year old.
Size:
Color:
QUOTE:
Eugene I see Basic Scorecard, Extended, MS123 in WLD x64, not found Lake ratio and K-Ratio ?
What need to install Extension ?
Switch the Optimizer to MS123 Scorecard before running a
portfolio optimization (N/A in Raw Profit mode).
Size:
Color:
Code in Ninja
CODE:
Please log in to see this code.
Size:
Color:
But this code doesn't account for the scenario outlined in my previous reply. Do you realize that "myEquity" is not the true portfolio equity but a mockup? Because what you're doing here is looping through all positions without considering that they can (and will) overlap in an MSB?
Example:
CODE:
Please log in to see this code.
Trade A sets a new equity high. Trade B does not. Why, if it had a good MFE it could've supported Trade A while they were being held simultaneously? Let's imagine that it could've stopped out on the last bar due to a sudden gap but still, it
could as well be setting an equity high (speaking of the
true portfolio equity here).
In addition, this makes your performance metric overly sensitive to the order of trades (to my taste).
Size:
Color:
For portofolio I don't know how this work and have result, I create this for 1 Symbol
We have identical System and Ticker, and find better parameter's where System have stability grows ( 100% all trades )
Size:
Color:
QUOTE:
For portofolio I don't know how this work and have result, I create this for 1 Symbol
You forgot to add: ...and for single position systems only. Extrapolate my example to a system holding multiple positions and you'll see that a similar problem arises.
To be included in a widely used library, a performance metric deserves to be more universal. But if you need my helping hand in programming this for your personal scorecard, just let me know.
Size:
Color:
Eugene you may create Simple example ( code ), how add this Metrics in our Scorecard for Single instrument's Systems ( For our Education ) :)
New High in Equity have big (meaning) ( current 1 Ticker - current 1 System ), This include all scenario with small drawdown, good trade's and many more other, other...
Ps. And this Metric's (( Number Trades which create new Equity High ) / ( Number All Trades ))*100 very easy understand for see System Optimization result for Lamers :)))
Size:
Color:
Such example already exists for a long time: the entire MS123 Scorecard project's source code is open.
Nonetheless, here's a closer example. It's pure on-the-fly coding (untested) to give you an idea:
CODE:
Please log in to see this code.
This method is the heart of a Scorecard. Overriding the rest is trivial; follow the MS123 Scorecard code for more:
CODE:
Please log in to see this code.
I deliberately do not present here a complete example because it's on-the-fly coding for educational purposes.
Size:
Color:
Ok Big Thanks, All work :)
For example for Trader's
Net Profit 12.000$ myFunct 12% (New High Equity Trade)
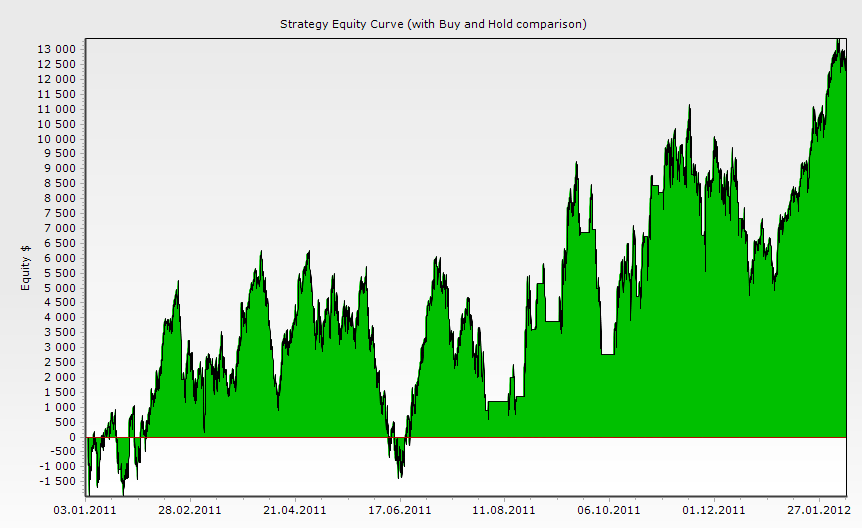
[/URL]
Net Profit 7.000$ myFunct 30% (New High Equity Trade)
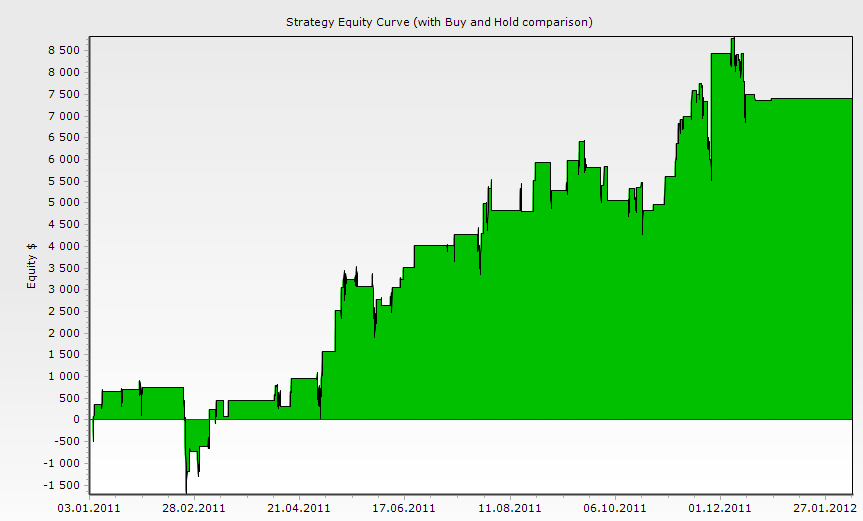
[/URL]
Size:
Color:
Ps. Critical for this Metrics, compare with approximately +- the same number of trades in same period.
For my System and purpose this good for fast find parameters, for other don't know :)
Size:
Color:
Anatoly,
Glad to have helped.
Size:
Color: