Hello, I have a problem I can not solve working in weekly timeframe.
I give you two pics.
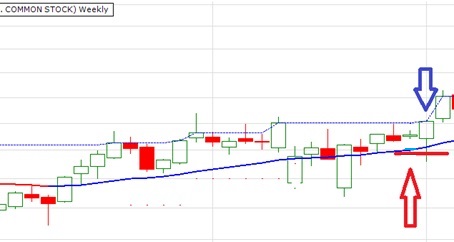
I draw a red arrow under the bar where all conditions are OK to put a BuyatStop (bar+1) Condition.
The StopBuyPrice is located in the upper blue dashed line.
I have also drawn the stop loss line with a solid red horizontal line where I will put my stop loss if BuyAtStop(bar+1) is true.
On the next bar with the blue arrow, price touches the StopBuy line and the BUY is done. Perfect.
But as you can see, Low price also touches the stop loss in the same bar where the BUY is done.
With this example it is easy to imagine,first price touched the stop loss (when the stop loss was not active) and then price raises to StopBuy line and then, system buys and puts the stop loss.
But we can have something like this.
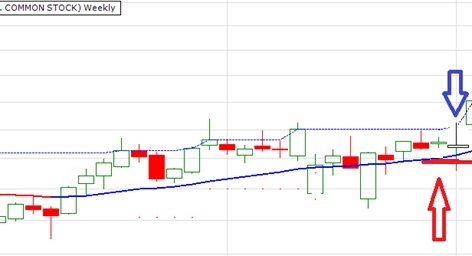
StopBuy is executed, but we have in the same bar, price touches StopBuy and StopLoss and I can4t know what happened first. Is there any avalaible intrabar calculation for entry and stop execution in Weathlab ? They are weekly bars, I am programming everything in weekly time frame so I suppose I can not SetScale in lower timeframe (dayly...) to find out if I must buy and sell after, or buy and not sell in the same bar.
Thanks in advance.