I would like to make the suggestion that the performance or some other page show statistics on average MFE and MAE. This way it would be much faster on subsequent attempts to set stop losses and profit targets.
As per usual just a suggestion.
Thank you.
Size:
Color:
Although you won't find them by the name "average MAE and MFE" we still have related performance metrics known as the
average trade, entry and exit efficiency. For the background on them check out this article:
Evaluating System Efficiency. These metrics by Zamansky and Stendahl are designed to improve your entries and exits. For example, Entry Efficiency is basically the MFE divided by a number similar to MAE:
Entry Efficiency = (Highest Price - Entry Price) / (Highest Price - Lowest Price)
You can find those metrics on the
Performance+ tab of MS123 Visualizers.
P.S. More MAE/MFE analysis:
Trade Graphs | MAE vs PnL
Size:
Color:
Hi Eugene!
Since you mentioned "Trade Efficiency" I was wondering why the "Coefficient of Variation" suggestion that Zamansky and Stendahl described in their article was never included in the MS123 Scorecard and the Performance+ tab. Could it be included in a future release? Thanks!
Vince
Size:
Color:
Hi Vince,
Thank you for the idea. I'm going to include the "Coefficient of Variation" in the Performance+ tab in the upcoming build. Although I'm reluctant to overload the already crowded MS123 Scorecard, the visualizer certainly has the room.
Size:
Color:
Thanks Eugene! I would suggest re-considering the decision not to add it to the Scorecard. The absence of the "Coefficient of Variation" makes it difficult to use an Efficiency metric in an optimization and then be able to identify the parameters that lead to the best solution.
Vince
PS. Perhaps I am "old fashioned", but there is no such thing as "too much" data from an optimization. I just collapse the columns of data of limited interest when I examine the results.
Size:
Color:
I see your point Vince. We've deviated quite far from "Average %MFE %MAE" but I'll explain.
Now just think about everyone else around the world who has to do the same thing as you every day, collapsing the columns as the Results table grows with more metrics. Most of these users didn't "subscribe" to these metrics as not everyone has a background in statistics. For them they do not sound "marketable" enough. Keep in mind we're talking about 3 coefficients here (entry, exit, total). Plus every performance metric consumes CPU cycles and long optimizations take time. The more you throw in the greater is the impact on the user base.
It's about creating negative user experience from the overloaded tab. Optimization metrics in the MS123 Scorecard must make sense to the average user who otherwise would tend to find some of them obscure. We always have to think about how a change would affect other users. Thanks to the open API, motivated users can consider developing their own
scorecard plugins. Hope this makes my point pretty clear.
Size:
Color:
P.S. Since we've hijacked OP's thread (apologies), let's rename it to reflect the trade efficiency discussion going on. Vince, I've got some concern re: the Total Coefficient of Variation for all trades. While its entry and exit counterparts return values as I'd expect them, this one typically tends to take much greater values like 300 or -850. Do you think they are realistic?
Size:
Color:
Hi Eugene!
Hijacked threads appears to be a way of life in some forums! ;)
The Efficiency for any of the 3 values (Entry, Exit, Total) will range from +100% to -100% (if I read the article correctly). The Total Coefficient of Variation is based on the Standard Deviation (which is the SQRT of the Variance). Therefore it must be positive and bounded by 0-100 I believe.
Vince
Size:
Color:
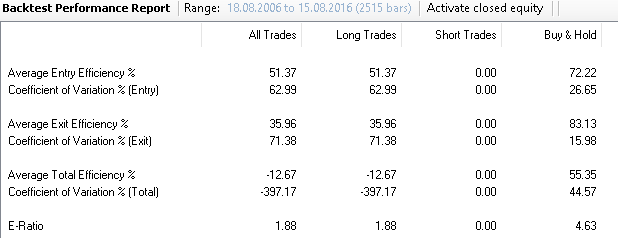
Thanks Vince. While I confirm what the article says about the range of efficiency (+100 to -100), please take a look at Figure 7. There, the Total Coefficient of Variation easily exceeds 133%. It does not have to be bounded I guess.
Another example off the internet, in
this report exported straight from TradeStation the figure is > 250% (see page 3).
Finally, on p.9 of
How To Read The New TradeStation 2000i Performance Report you can see how all the 3 numbers exceed 100%.
So I guess my calculations are fine.
Size:
Color:
Hi Eugene!
I just notice something "strange" in the article that I missed or overlooked previously.
"Coefficient of Variation = Standard Deviation / Average (in %)"
The denominator in the equation makes no sense! If it were to be zero the equation blows up, and more importantly all values of the denominator around zero lead to absurdly high values. The authors should have used the simple Standard Deviation. Pure ignorance on my part for missing that previously (I suspect that I AssUMed that they were using the SD :( ) and now it calls into question the value of that metric totally.
I am sorry for starting this process Eugene since I can no longer see any value for the Metric as the original authors defined it. However, the simple SD would have value.
Vince
Size:
Color:
Hi Vince,
You repeatedly mention the Standard Deviation as the denominator but it's already the numerator. Please clarify.
Size:
Color:
Hi Eugene!
The Denominator (Average (in %)) is the culprit here. For example, the Average Total Efficiency could be near zero and result in extremely large values for the Coefficient of Variation, even if the actual variation is quite low.
This is why I am suggesting using the simple Standard Deviation for the calculation.
Vince
Size:
Color:
So what you're proposing is to replace the Coefficient of Variation itself with the Standard Deviation (the nominator), right? That's not very visual as a performance metric.
Size:
Color:
Hi Eugene!
QUOTE:
So what you're proposing is to replace the Coefficient of Variation itself with the Standard Deviation (the nominator), right?
Correct.
QUOTE:
That's not very visual as a performance metric.
But it would be an accurate means to assess the spread of the results of the simulation.
Vince
Size:
Color:
Thanks Vince, your point makes good sense but such metrics create a geeky impression whereas I'd like to keep MS123 Visualizers more "marketable". Since we've got two Standard Deviation lines already on the Performance+ tab, the three more might become somewhat confusing. And since you've called the Coefficient of Variation into question this idea has to go back to the drawing board until a future release.
Size:
Color:
Hi Eugene!
No offense, but designing and implementing trading systems is geeky! ;)
OK
Vince
Size:
Color:
Vince,
On second thought:
QUOTE:
The denominator in the equation makes no sense! If it were to be zero the equation blows up, and more importantly all values of the denominator around zero lead to absurdly high values.
If the denominator, a.k.a. average entry/exit/total efficiency, were to be near zero you wouldn't want to trade that system
anyway. For systems worth looking at the entry/exit efficiency is expected to stay above 60% (or 20% for the total efficiency). So I guess that the Coefficient of Variation isn't
that bad to discard it.
Size:
Color:
Hi Eugene!
QUOTE:
If the denominator, a.k.a. average entry/exit/total efficiency, were to be near zero you wouldn't want to trade that system anyway. For systems worth looking at the entry/exit efficiency is expected to stay above 60% (or 20% for the total efficiency).
You do make a good point. Perhaps it is worthwhile in that format.
It is just that the construction of
ANY metric where the denominator can have values near zero bothers me (intellectually?) :(
Vince
Size:
Color:
OK so I'm including it in the upcoming update next week.
Size:
Color:
Thanks for the effort Eugene!
Size:
Color:
Vince, check out v2016.09 (just released) for the Coefficient of Variation.
Size:
Color:
Thanks Eugene!
Size:
Color: