Seeking Alpha.
This is a continuation of some comments I’ve made in various threads in the WL-4 forum over the past 4 years on achieving higher performance than the Buy & Hold strategy. Some of these comments ended with: “I can’t go any further… without…” revealing how it could be done.
About 6 months ago, I started writing a new post with the intention of providing a more detailed account of my trading methodology and philosophy. From a simple post, it grew to about 15 pages of text in no time, and was really getting too big to post. After having a friend read this “post”, he concluded that it was not enough! It needed more explanations and more: “how did you reach those conclusions?” Following his advice, I’ve added more explanations with the results that now (only a few months later); this simple post is over 40 pages long.
The paper, “post”, can be downloaded from
here.
Consider it a follow-up to many of the statements I’ve made in the past. You can even find traces of equations and methodology used in my very old WL-4 posts.
In this paper, you will find a trading methodology that puts the Sharpe ratio on steroids, meaning that the Sharpe ratio will increase exponentially with time; you will find the background theory as well as sample results which led to these conclusions. I wanted to make the release of this paper as discrete as possible, however, I believe this paper has the potential of shaking the foundation of one of the most basic portfolio management equations.
The concepts, trading philosophy and methodology implementation presented in my paper should help open up new avenues to consider, explore, develop and expand as a whole family of such solutions can be reached.
A portfolio management paper I’ve read recently that relates to what is presented in mine:
Stochastic Portfolio Theory: an Overview. By: Robert Fernholz and Ioannis Karatzas. (Download preview from
here). It is available in book form on Amazon.
Before anyone cries fowl play, self promotion or something of the kind, let me say first that my paper is free with absolutely no strings attached. I wanted to present a different point of view which as you’ll read in my paper is centered on position sizing in face of uncertainty. And I also hope that it will raise some questions on your part as to what to do to better achieve your own goals. Your comments as to how to improve on the methodology would certainly be appreciated. However, be prepared to have some of your trading notions challenged or reinforced.
Happy trading.
Size:
Color:
Roland,
Your paper seems to suggest that we can use any trading models and yet achieve returns that are significantly greater than that of B&H. The method is by using 1) portfolio diversification and 2) using a position sizing algorithm which is based on AA adjusted Sharpe ratio.
Could you share some thoughts on how such a position sizing algorithm can be developed? How would you propose adjusting the weights?
Size:
Color:
dannyoh,
< can use any trading models>: No, but you can use a lot of strategies that follow the general trading philosophy presented. This is not a dip buying program, it is a long term accumulation program mostly paid for by the market itself. Check Figure 10 and 15 with accompanying explanations.
< using a position sizing algorithm which is based on AA adjusted Sharpe ratio >: The results were first obtained, the adjusted Sharpe ratio is an attempt to describe as best as possible what is happening as the trading system evolves. It is only after finding a reasonable explanation (the adjusted Sharpe) that I got more and more convinced of the results and the merits of the trading philosophy itself.
< how such a position sizing algorithm can be developed >: Most of our efforts are centered around finding a rising price or predicting future prices, yet very little is done on predicting what you want to do with the quantity traded (position sizing) as your system evolves. All the paper is about generating alpha (aka your skills) to obtain better performance within the limits of what is going to happen, even if you don’t know what is going to happen. Reread the section on the horse race comparison. It should give you more ideas.
Its like playing a game within the game (your game): you set your own trading rules that have to survive what ever is thrown at them over the long haul. If you look back at equation 16 you will see the separation between price and volume; it should serve as a guideline for your own research. At least you now know it is possible to do more.
I do not provide code, (quite understandably). However, I do think that there is enough in the paper to design your own strategy which could even surpass mine.
Happy trading.
Size:
Color:
Roland,
Thanks for your clarifications.
I have some difficulties understanding equation 16 as there are some unknown symbols in the equation which I cannot find any descriptions for them. Could you describe equation 16 here again?
Size:
Color:
dannyoh,
Not providing a complete description of equation 16 is intentional. I’ve made claims on this site in the past saying that it was possible to do much better than the Buy & Hold and this paper simply corroborates my claims.
Equation 16 governs how it is done, whereas equation 4.1 is the explanation as you can see in Figures 4 and 13. Equation 16 has two distinct parts; one which is simply Jensen’s formula: equation 7 (found after the price P), and the other controlling the quantity traded found before the price (between Q and P). There is a stop loss function for quite obvious reasons; there is an enabler function which translate to the equivalent of hold or do it when needed; there is a behaviour reinforcement function used to reward best performers and punish poor performers; there is a partial excess equity use function to control the fraction of profits (excess equity) that will be available to the best performers should they perform according to plan; there is an added leverage function to better control the use of the partial excess equity (all without using margin).
You know in advance (for the 20 year period) what you will do with all the 50 or 100 stocks in your selection. Again look at the horse race comparison starting on page 30. You know in advance the maximum cash that will be needed to implement your scenario (see Figure 10) and you also know in advance that only the stocks that perform according to plan will receive reinforcement (see Figure 8).
The paper should serve as a guideline for whatever system you want to develop, it is not the only way to do the job; there is a whole family of such systems that can be developed, that is why I’m making the basic framework public.
What I personally think has greater value is not necessary equation 16 but equation 4.1 or 11, which implies that one can obtain an exponential Sharpe ratio over the long haul. The Share ratio hasn’t changed since the sixties, only Jensen added a complement in 1968. But in both cases the long term linear regression of the Sharpe ratio was a straight line with very little positive drift when at times none at all.
And if you look at all the literature on portfolio management (I must have read 50 papers in the last 6 months as the one cited in the first post), you will quickly notice that no one dares present an exponentially adjusted Sharpe ratio. Not only that, in my paper, it is presented using relatively simple math compared to some of the papers I’ve read.
I hope this clarifies some of your questions and help you develop your own trading strategy along the same lines. I believe it is well worth the effort.
Happy trading.
Size:
Color:
Roland,
could you provide the random data series you used in the paper?
Thank you,
GWolf
Size:
Color:
GWolf,
Every test run resulted in completely new price series. There was no seed used in the random data generation. I am therefore unable to replicate the data in the paper. This was intentional making every run unique and unpredictable with no curve fitting or optimization on a single stock possible. That’s what gives the paper value: what ever was presented on each run as price data series, the portfolio achieved exponential growth with an exponential Sharpe.
However, I could extract the data from a single run and send you a copy with the understanding that it is unique just as the next data series will also be unique. Since I’ve started analyzing the 100 by 2000 scenario as in the paper on about the same principles (read with improvements); that random data series could also be made available. Maybe you should start with the 50 by 1000 week scenario. There is a question of file size here. What ever, state your choice, you have my email address in the paper.
Size:
Color:
More on seeking alpha.
Some might be interested in reading: “On Optimal Arbitrage” by the same authors as the one in the first post. It can be downloaded from
HERE . It is a recent preprint and well done.
In the above paper, the authors make the case that the most probable outcome on portfolio return is to achieve an overall rate that is close to the long term average market return (meaning close to the secular trend or in plain text: close to a 10% average over the long haul). Also, a mathematical demonstration is made that it is the best you can expect and therefore should consider a combination of an index fund and money market fund. Their presentation leads to a relatively constant Sharpe ratio as price leaders are partially sold to increase the holdings of laggers which in turn will have a tendency of maintaining a relatively stable risk ratio. The optimal trading strategy is presented as a mix of risky and riskless assets leading to the search of the optimal portfolio residing on the efficient frontier.
In short, if you needed arguments to torpedo my own research paper presented in the first post, the above mentioned paper (and many others like it) could possibly provide all the ammo you need.
The paper I presented has far reaching implications and may require reformulating some basic equations of modern portfolio theory. It is not only the exponentially adjusted Sharpe ratio that is concerned; even the Capital Market Line (CML) will need to be re-adjusted to reflect the exponential Sharpe since technically the Sharpe ratio represents the risk premium over volatility - which in turn is the slope of the CML. This would imply that the CML can rise exponentially (up to a limit, again see my
paper ) which goes against accepted notions of portfolio management theory. And yet, my paper makes that claim. It also states that trading methods can greatly improve performance when the literature on this subject has a hard time extracting an edge in any mechanical trading methodology as more often than not it is shown that the stock market game is a zero sum game (to which I agree). And yet, my paper shows that trading methods can be found and implemented that produce better than average returns even in the worst possible trading environment where all price series are randomly generated; where no selection bias, curve fitting or over optimization is possible.
When designing a trading strategy, one must maintain: 1) Feasibility, 2) Marketability, 3) Sustainability, 4) and remain realistic in a real world trading environment. There is no trading of a million shares of a penny stock that should be considered realistic. I’ve covered these points before. There has to be someone on the other side to take your trade what ever your intended volume in whichever direction. Selection survivability has also to be addressed in order to contain market risk. Putting 100% equity on a downer is not a realistic way to generate portfolio profits as once in a blue moon, this downer (a black swan) has the potential to blow up your account which in turn puts you out of the game with a score of zero. One has to manage risk at all times whatever may happen.
Happy trading.
Size:
Color:
Roland --
I've read your paper, and -- maybe I'm missing something -- but I fail to see an actionable trading system described here (which is what I believe some of the previous posts were getting at). I don't see any criteria for determining which is a winner and which is a loser, or over what time frame. As we know, with daily upticks, EVERY stock is both a winner and a loser throughout its life. And just because a stock did well over the past year doesn't mean it will continue on that trend over the next 1 or 5 or 18.2 years.
If I'm mistaken about that, please, please enlighten me.
Based on my read of your paper, your strategy seems to be: "Kiss as many frogs as you can, and only hold onto the ones that turn into princes."
Which is not to say that it's wrong. Perhaps your model suggests that, once you've located the early winners, they have an advantage over the rest of the field going forward, even if their performance reverts to mean. That is, the stocks that went up 20% while everybody else did 8% have a built-in performance advantage. They've already lapped the rest of the field, so even if they drive no better than the rest of the field for the remainder of the race, they're likely to win.
In other words, if you continually kill the princes that turn out to be ugly after all, all your money will be clustered in the few stunning princes -- now monstrously large, given that our measure of looks is $ performance. Consider your Figure 8, where a handful of winners establish themselves fairly early, and from there go on to shoot the moon. And the real world is indeed like this: over a given period, SOME company will end up fitting this pattern of a superstar. Kind of a Darwinian, "Survival of the Lucky" strategy.
Hmmmmm.
So, are we taking the proceeds and investing them in the entire remaining universe? Or just in the top 10% of holdings?
And how large a population do we need to start with to have a reasonable expectation that a prince is in there somewhere?
It strikes me that your criteria for distinguishing between the Frogs and the Princes cannot be recent performance, it must always be Performance To Date.
Also, it also strikes me that there needs to be a replenishment dimension built in, so that you are constantly able to find a new supply of possible princes to replace AOL and MSFT when they're "wearing the bottoms of their trousers rolled." As your # of holdings winnows, you're reducing the likelihood that any one of those holdings will perform outside the norm. So, when your holdings are down to [how many: 4? 10? 20?] do you slay the entire herd and start over with a new crop?
Perhaps an IPO model makes sense. Buy $X of every IPO that comes out, and divest yourself of the ones that fall in the bottom [quintile or decile] after some holding period, plowing the cash into the survivors. Over time, a group of superstars emerges: "In the Class of 2001: The valedictorian was XYZ... The salutatorian was ACDC Corp!... (etc)."
Or do you continually take some % of your ongoing harvest and put it into new livestock in an ongoing way?
How can we fashion a WL model that tests these assumptions?
Size:
Color:
TheInvis,
James, you provided many questions in your post; I will try to answer them with what follows:
The prices for the 50 stocks were randomly generated following equation 1 for a 1000 week trading interval (see Figure 16 for an example); all price fluctuations, for every period, were unpredictable in direction and size. There was no way of knowing which stock could win or lose the race, sort of speak, until the finish line was crossed. So, no early lead could assure a stock to be in the winning circle or to finish the race for that matter. Each test run was a totally different race with no correlation with any past or future race except for the general tendency for the average of all prices to rise over the long haul as explained in the paper.
If you refer again to Figure 8, you will notice that stocks PFT37 and PFT25 came in very late “in the stretch” to grab second and third place in that particular run. In a subsequent run, results would be totally different. The point being made is that I could not know which stock would finish the race and in what order, so I implemented a trading strategy where I rewarded performance as price evolved, thereby buying more of the stocks going up and punishing or not rewarding stocks that failed to go up.
No forecasting method is being used, so questions as to guessing early on which stock had a better chance of finishing first became irrelevant as prices were unpredictable from day one. There was no way of knowing from week to week which stock could perform the best or the worst or which stock would go up or down and by how much. Price variations had an expected mean very close to zero! The signal was drowned in the all the random noise.
In short, the game presented is being played where you don’t know today which stock will be at the finish line 20 years from now; where you don’t know how much it will increase in price if at all and where you don’t know which stocks will go bankrupt. It has many resemblances with the real world. And yet, you want to optimize your performance in such a way that what ever happens over the next 20 years you end up with most of your money in the winners and with as little as possible in the losers. So “you kiss many frogs” and place you bets incrementally on the ones which slowly and progressively are turning into princes over the 20 year span. You only find out at the finish line who were the real princes as a lot of them stayed near frogs if not dead frogs.
To design a trading script out of this paper, you need to solve equation 16 and design your own along the same lines. Understandably, I do not provide code. I only wanted to demonstrate that it was possible, long term, to perform a lot better that the Buy & Hold as I have claimed so often in this forum.
As the paper also states, no replacement was done for stocks touching zero. Replacement will be added in the future as there is too much equity remaining unused as time progresses. Presently, I am working on the 100 stocks over a 2000 weeks scenario with some added features to better control unused excess equity. My main point of interest being to find where after the 19 year period does the exponential Sharpe ratio starts to slow down. My Excel spreadsheet currently has over 3 000 000 cells filled with interrelated formulas and making over 210 000 calls to the rand() function for a single run, every run being unique.
One of the outcomes of my paper, for which I am quite proud by the way, is the adjusted Sharpe ratio to account for the exponential alpha thereby improving on a formula that hasn’t changed over the last forty years (see equation 4 transformed into equation 9 as a result of the execution of equation 16). I consider it a major statement since one of the side effects is to also redefine the Capital Market Line (CML) and transform it into an exponential curve, like adding a new dimension to the current understanding of the risk to reward ratio. This is the first time, to my knowledge, that such a strong statement is being made in a financial paper and it has far reaching implications which I will continue to investigate.
Size:
Color:
(I've been traveling for a few days, so pardon the delay. I'm completely fascinated by this thread, but want to be sure I fully understand the meaning and implications.)
ROLAND:
I agree that you should be proud of your work. It strikes me that it shakes the foundation of traditional research and trading strategy.
Given that it works against purely random data series, how does your position-management algorithm pan out against actual market data? Does the not-fully-random nature of the actual trading markets obviate some of your Alpha?
Also, can you save some of your Synthetic Universe's random data sets in ASCII and post them for us [masochists] to use w/WL?
Jim
Size:
Color:
Jim, your questions are very thoughtful, however, understand that I can provide close to an answer, but no code.
<Given that it works against purely random data series, how does your position-management algorithm pan out against actual market data? Does the not-fully-random nature of the actual trading markets obviate some of your Alpha?>
Like I’ve said before, data sets in the paper were generated by equation 1 (using normalized prices + drift + random fluctuations). Normalized in the sense that the initial price was reduced to 20 and all subsequent prices were adjusted percentage wise to reflect the price adjustment factor; this way making all prices behaving as if from the same initial price (this naturally with no lost of singularity). The drift was set on average at about $0.10 cents per week or $0.02 cents per day, meaning that that too was randomly set with a range going from positive to negative (a little higher, a little lower). You could not know in advance what the average drift for a single run would be, you could only know that on average the drift for the 50 stocks would tend to be positive over the 19.2 year period and close (statistically) to the 10% secular market trend. The random fluctuations were also random from run to run; there was no way of knowing which particular stock price would behave in any specific way; thereby each stock in each run would have its own signature.
As I wanted random fluctuations to behave in a Paretian manner rather than Gaussian - which would have been a normal distribution - I had to simulate a Paretian distribution. The trick used was to add three Gaussian distribution with increasing sigma and decreasing probability of occurrence; thereby generating a closer approximation to a Paretian distribution (generating fat tails with low probability).
Show your email address (or email me at the address in the paper) and I’ll send you a sample price run in Excel format, easy from there to transform it in any way you wish. Understand that that particular run was a single event that I can not duplicate. Another run would mean totally different numbers for all data series (which is what I wanted in the first place – no predictability) however notwithstanding, the statistical general performance would still be more than positive.
The real stock market price generation is a quasi random process and I think it would have more volatility that the data generated in my test. This would result in even higher returns that those presented as the system seeks to put the most money in the highest performers. Some stocks in real life have two to ten times higher performances than the limiting factors I put in my tests; so overall, performance would have been greater. Please note that the tests for any run is over 19.2 years, this is not a short term trading system or a method that select stocks at random. Since the method is looking long term, your stock selection should also be for a long term horizon. Having a long term view doesn’t mean that you can predict the future any better than anybody else.
Overall, the system is a compromise; it balances limited capital, unknown future, and reinforcement trading by controlled position sizing in a random environment where some 28% of stocks can fail. Still, the system needs to remain tradable, feasible, sustainable and realistic in time, which is not an easy task. A trading system needs to evolve on its own with time with having for objective taking less and less risk as the portfolio grows in the sense that each trade becomes a smaller and smaller fraction of the total.
Size:
Color:
Here is another interesting paper; this time the subject is financial expertise defined as a combination of skill, experience and market knowledge: another way of saying alpha and how hard it is to get. The document might be narrative with no mathematical formulas, but nevertheless, the points covered are worth noting. It can be downloaded from
HERE .
In this document you will find numerous citations on the difficulty of producing worthwhile alpha. It is a survey, of sorts, analyzing experts and how they do in the markets. It provides a long list of references at the end.
Size:
Color:
Hello Roland,
I just have finished reading your paper.
How does the "accumulation strategy" behave compared to Buy&Hold if there is no positive drift?
Even if we could expect a positive drift over a time period of the next 20 years, I think you are making
an assumption in your paper that is not mentioned and which is different to real market behaviour:
You expect that the positive Buy&Hold performance within 20 years will come from the stocks in the beginning of the run. In reality it could be that you have a strong bear market within those 20 years and all the stocks go to zero. These will then be replaced in realtiy an contribute to the Buy&Hold performance of the rest of the time period. You make the assuption that there is no survivorship bias in the stock market, don´t you?
But maybe I just didnt understand correctly!?
Size:
Color:
Hi dansmo,
Since 1792 the US market has not seen a negative return over any rolling 20 year period; meaning that no 20 year period has ever had a negative drift. The assumption made in the paper is that in probability (asymptotically close to one) it will also be the case for the next 20 years or the 20 years after that. Even this should be debatable as the future often holds surprises. But nonetheless, removing the drift from equation 1 will result in a pure stochastic representation of the game (same as playing heads or tails) whereby your expected performance for the Buy & Hold would be a zero gain. You would end up with an expected total return of 0%.
Recently, I ran a series of 100 tests with zero average drift at someone’s request. The Buy & Hold produced on average a zero return as should be expected while the alpha adjusted methodology maintained a decisive advantage. The graph below looks a lot like Figure 12 in my
paper except for the scale.
Zero drift scenario chartThere seems to be about a 10:1 reduction in scale on the average zero drift scenarios, but it still does perform a whole lot better than the Buy & Hold. Normally, both lines should have been superimposed since a zero drift gives no edge, a zero expected return and zero appreciation. But this was not the case for the adjusted alpha method even thought on a zero drift scenario some 72% of the stocks on average would go bankrupt over the investment period which is a lot more than what could be expected in real life. There has never been in any 20 year period in the history of US markets where all the stocks went to zero.
< You make the assuption that there is no survivorship bias in the stock market, don´t you? >
No, on the contrary, in my paper, it is stated that you can not escape survivorship bias and that up to 28% of stocks could go bankrupt in a single run. And even with this high rate of failure, the method thrived on positive drift over the 20 year test.
The paper states that the methodology used is a glorified Buy & Hold strategy with the twist that with part of the accumulated excess equity you buy more shares of the winners thereby slightly leveraging your portfolio. When you look from the outside, the method looks deceptively simple. You will see it buy a few hundred shares here and there always at higher prices (see Figure 5). Shares are accumulated following simple objective functions.
The trade off being made using the alpha adjusted Sharpe ratio is that you accept to exchange price predictability (which you can’t predict) for behavioural predictability. It makes all the difference.
dansmo, it is the first time in the last 40 years that someone challenges the precepts as formulated by the Capital Market Line (CML). The CML has always been considered a limiting boundary tangent to the optimal portfolio. No one dared cross the barrier. I simply jumped over it and found a whole family of optimal portfolios residing over and above the CML and having the singular property of having exponential curves in risk-return space. And as such, equations 9, 11 and especially equation 4.1 represent major statements in portfolio management theory.
Size:
Color:
Hi Roland,
The paper states that the methodology used is a glorified Buy & Hold strategy with the twist that with part of the accumulated excess equity you buy more shares of the winners thereby slightly leveraging your portfolio. When you look from the outside, the method looks deceptively simple. You will see it buy a few hundred shares here and there always at higher prices (see Figure 5). Shares are accumulated following simple objective functions.
That is exactly what I have understood when reading the paper. The horse run is a very good example.
But, I think I could not express my thoughts correctly.
You are assuming that for a rolling 20 year period, that it is exactly the 100 (or n) stocks in the beginng that contribute to the positive drift 20 years later.
The Dow, or any other index, is an eveolving watchlist. The stocks that could be responsible for the positive drift may not be in your list at all , since these could be skyrockteted IPOs at year 18 or so, and are therefore not in your list.
Do you understand my worries?
Size:
Color:
Hi dansmo,
Yes, I understand your point of view. However, the method bypasses all those considerations. It does not know in advance which stock will contribute the most either from your selection, or from the entire market, over the next 20 years. So it does not even try to seek them out. Your initial selection is just a small sample from the available stock universe.
< The stocks that could be responsible for the positive drift may not be in your list at all >
Most of them won’t for sure. You are taking only 50 stocks out of a possible 8000 to 9000 universe. You will be missing hundreds of better performing stocks than in your selection. But that does not matter. You can select your initial 50 stocks using what ever method you think is most appropriate for the task and make the best selection you can. You will still miss hundreds of better performing stocks.
However, with your 50 stocks selection, you have a very high probability that your selection will be representative of the whole market. Some consider it takes only about 30 stocks to be considered well diversified.
As in the horse race, you start with “a selection” – you don’t know which horse will drop dead on the track or will cross the finish line - and you let them do what ever they wish to do: go up, go down, go sideways or die. As time evolves, you can replace the ones underperforming or dropping dead with all new selections. The tests in my paper were done with no replacement, but as stated also in the paper, performance would have been higher had replacements been implemented.
The stocks not in your selection have little relevance to your performance.
Size:
Color:
Hi Roland,
You've addressed the assumption of positive drift over rolling 20-year periods with your zero-drift scenario.
However, dansmo seems concerned about a potential problem when implementing this strategy. His question seems to be: what happens if you happen to select mostly stocks with zero (or negative) drift?
My thought is that even if only one or two stocks have positive drift, the algorithm will concentrate the portfolio in those securities.
Size:
Color:
Hi,
the main and most important assumption Roland is making is the positive drift in the overall market.
Since he selects 50 stocks (maybe the 50 highest market cap or whatsoever criteria)he is making a second assumption:
the selected portfolio of 50 stocks must be representative of the whole universe and such rebulid the expected positive drift over the next 20 years.
Am I to negative, if I say, that it could very well be, that none of these stocks contributes to the positive drift? At least not in a way to ensure a 10% return p.a.?
Then, all comes down to the projection, that I am able at the beginning to choose which stocks are representative of the 20 year drift.
Roland, maybe you should modify your test like this:
We have a 10000 stock universe in the beginning, and the program selects 50 out of them randomly. The only thing you know is that the 10000 shares will have a positive drift together, BUT you dont know which of them. Additionally you could add IPOs and reselection if one of the beginning 50 goes bankrupt.
I think only then your calculations and results will be realistic.
I hope I could make my point clear to you.
Size:
Color:
Hi Josh,
Yes, I do catch your “drift” and totally agree.
However, as stated in a prior post, in the zero-drift scenario, on average, 72% of the stocks failed (ranged from 64 to 86% failure). That is extremely high even for someone willing to throw darts at the financial pages, but I will not argue the possibility and probability of selecting mostly non performing stocks, it is there, low, but it is there.
A test to answer your question would require going back say 50 years. Perform 10 000 selections or so of some 50 stocks with replacement from the then existing stock universe (including all bankrupt, merged and delisted stocks) based on a series of informational parameters available at that time. Run these tests on a rolling 20 year period and average all these over all types of performance measures. Then redo the test with a 100 stock selection based on the same or hundreds of more elaborate parameter sets. Quite a task! But such tests have been run before, and the answer is: on average, you obtain the average market rate of return over the long haul, meaning that you get the same average “positive drift” as the secular trend. And on average your portfolio will reside below the Capital Market Line in risk-return space (see Figure 1). What you want to do is to jump over this Capital Market Line and stop considering it as a limiting barrier.
What I say is that “normally” and most “probably”, you can not be that bad and select from what you think may be your best present 50 stocks and end up with only 7 survivors or less. Even survivorship bias has been shown to reduce your overall portfolio return by about 3% over the long haul. Naturally, if there were only one or two stocks remaining at the finish line, then the entire portfolio would be concentrated in those two securities.
But then again, also consider, that what ever other trading method you would want to use would suffer from the same trading environment. It might be preferable to have a strategy with a heavy bearish bias over the long haul. Any trading method with an affinity to buy on the dip might also prove to be just a random slide down to portfolio oblivion.
Hi dansmo,
I think the above also answers your questions. The way my tests were ran used about the same procedure you describe. Each test was like picking 50 stocks at random from an unlimited universe with no replacement. Adding replacement would only improve performance due to the “positive drift” scenario. I normalized all price series to 20 in order to treat them all the same percentage wise. So a stock starting at 60 had its whole series divided by 3 thereby providing the same initial starting point for all. The whole objective was to make the tests as realistic as possible and try to find ways to increase alpha in such a way as to have your whole portfolio reside above the Capital Market Line.
Regards
Size:
Color:
Here is another study on how hard it is to exploit market anomalies. It makes the case where alpha can be positive when dealing with low priced stocks and low volume resulting in low capitalization stocks. However the cost of trading at this level makes it hard to establish big positions.
The study can be obtained from
HERE .
Happy trading.
Size:
Color:
Here is another interesting paper dealing with alpha (available
HERE ).
It looks at the stock price predictability problem from the practical side, meaning that you might not know which criterion to use to outperform in the future. It makes the case that hindsight may be good for selecting best trading procedure in back test but that these same procedures might not perform as well out-of-sample.
The study shows that price predictability may have been exaggerated in the financial literature and that hindsight introduces a bias in in-sample testing.
Quite an interesting read. A far cry from my own paper where hindsight is not even applicable except in the most general of terms.
Happy trading.
Size:
Color:
Recently, the market might show that there are no free lunches and that your predictive powers leaves a lot to be desired; it does not change the fact that you can redesign the way you play the game in such a way that you can extract what you want from the game all within the constraints imposed by the game (market) itself. And, I would say, you could even push the arrogance to the extreme and let the market pay for it all…
HERE is another study, this one is for the more mathematically inclined as you will notice reading through this elaborate maze in support of the stochastic portfolio theory. However, in the end, what it says is that it is quite hard to beat the market and that your most probable outcome is to achieve something close to the market average. It is so hard to escape from the market average that it does not even provide the extra benefit of what could bring some alpha as in the previously mentioned paper.
It might sound reasonable to split hairs in halve, forth or sixteenth when trying to elaborate a theoretical mathematical model of what the market should be or do but when you have to decide, now, on your next trade, risk management really kicks in, in an attempt to save your ass..ets. And it is this risk management with position sizing on your own terms and constraints coupled with mid to long horizons that can give you an edge.
Size:
Color:
This is kind of a follow-up to my previous comments and an attempt to provide more clues as to what to look for even if it is out of beaten paths.
It is mainly intended for those that have followed this thread wondering where it all leads. It is about my
latest equation , my latest attempt at describing part of my trading philosophy. I hope it can be of use to someone.
Just as a teaser, here is the formula

Added later: missing explanation.
What the equation says is that the current value of stock holdings minus the total cost of said holdings equals the sum of current net profits. And the sum of net profits on this exponential curve will be determined by the time it takes to reach (P[sub]t[/sub]) from (P[sub]o[/sub]) and the size of your initial (i[sub]q[/sub]) and ongoing bets (a[sub]q[/sub]).
It gets even more interesting when the incremental bets (a[sub]q[/sub]) follow a function instead of a constant as in the equation presented.
Happy trading.
P.S. (P[sub]o[/sub]) is for P subscript o. I don't know the html code needed for it to appear correct.
Size:
Color:
A very interesting thread.
I haven't had a chance to read your paper yet, but I certainly will (to get a better understanding of your ideas).
Just one question: if you are laying heavier bets on the winning horse, where is that money coming from? Are you taking them away from the losing horses?
Is it a self-financing-portfolio or is there infusion from the outside?
It's a bit funky because your generating process has no auto-correlation (in the zero-drift case, but I guess if you have drift, then you can get auto-correlation, but it can be from any/all horses - not necessarily the currently winning one), but by emphasizing the winning horses, you are implying auto-correlation (ie the winning horse will continue winning).
Hmm... ...that confuses me a little: "better alpha" coming from the currently winning horse (given the way the time-series is randomly generated, with no favorites).
- Ken
Size:
Color:
Hi Ken,
You have many good questions here with some requiring more than a yes or no. So I’ll try to answer them as clearly as possible.
QUOTE:
Is it a self-financing-portfolio?
Yes, the portfolio is totally self-financing. See the section on capital requirements in my
paper, (starting on page 26, Figure 10).
QUOTE:
where is that money coming from?
Take a second look at the horse race. From the starting line, a small bet is made on each horse: a small fraction of its allocated trading capital. Nothing else is done unless the price goes up in which case more funds will be allocated to advancing horses. Those that trail are left behind, in the sense that no new bets are applied. As horses advance, their initial allocated capital will be used (their allocated cash reserves). At some point as prices rises, the method will start to use a fraction of the excess equity buildup (profits) to continue purchasing shares; using part of the paper profit to acquire more shares only in the cases where prices are going up. There are no purchases on the way down in this method; strictly speaking, it averages on the way up.
Also, a big sample (50 to 100 stocks) was taken which will mimic the market by simple naïve diversification which in turn, if no position sizing was applied, would perform relatively close to a long term market average. It is the method by which you play the game that will make the difference.
QUOTE:
the winning horse will continue winning
No, no such assumption is being made. The method does not know which horse is going to win the race, but as each furlong is reached, it can easily see in which order all horses are on the track. From any point in time, the method can not know which of the horses in the race will finish as the best performers or will just drop dead on the track. Some can even come from behind and win in the stretch so to speak. There is no way of knowing.
QUOTE:
"better alpha" coming from the currently winning horse
You can know at any point in time, meaning when it’s reached, what is the order of performance for all participants in the race. The “then” winning horse can have a “better alpha” (actually, the best alpha) but there is no guarantee that this edge can be maintained. There is no way to predict the outcome of the race.
If you look more closely at the equation in the previous post, you should notice that all the generated net profits come from the betting (position sizing) methodology used. Changing the position size as the race evolves by switching bets around in favour of the leaders, will eventually put most of the money in the leaders, and most probably, the then bet size (by size) will be in order of performance, in order of finish at the finish line. And which ever the winners of the race may be, they will have pushed your portfolio to new heights.
Happy trading.
Size:
Color:
Thx for posting, Roland. Very interesting concepts, for sure.
Size:
Color:
Very interesting, indeed.
QUOTE:
You can know at any point in time, meaning when it’s reached, what is the order of performance for all participants in the race. The “then” winning horse can have a “better alpha” (actually, the best alpha) but there is no guarantee that this edge can be maintained. There is no way to predict the outcome of the race.
It seems to me that this anti-rebalancing (regular rebalancing puts more money on the losers) is a way to harvest temporary trends in the series.
Let us say there are two strategies: rebalancing (rebalance in favor of the losers) and anti-rebalancing (rebalance in favor of the winners). How would you expect these two strategies to behave in the following environments?
CODE:
Please log in to see this code.
For example, "A" would represent a buy-and-hold type strong bull market (which may turn into a bubble, eventually). The recent US equity markets are probably in "J".
Given only two money management strategies: rebalance and anti-rebalance, which one do you think would work best in which environments?
- Ken
Size:
Color:
Ken,
QUOTE:
Given only two money management strategies: rebalance and anti-rebalance, which one do you think would work best in which environments?
The method does not do “anti-rebalancing”, it simply reinforces what I consider appropriate behaviour at the portfolio level; meaning that the stocks which are leaders of the pack will be favoured with rising inventories while the laggards or those trailing will be left behind with their small initial bets, no additional bets, ignored or simply disposed off due to stop loss execution. Only on the condition of price advance will a laggard start to see progressively increasing bets. On what basis would you increase your bets on a non performer: because it declines less than other stocks. That’s not a very good reason; it will still have a negative impact on your portfolio.
What is proposed is a Darwinian system; where only the fittest gets reinforcement based on their respective relative strengths. From the small initial bet, if the drift is down, nothing will be done except maybe execute the stop loss. The same goes for scenarios where prices are not going up. Small upside drift, small reinforcement, larger positive drift, larger bets relative to whole portfolio. The method ignores temporary trends, they might trigger some trades here and there, but that is not the main focus of the strategy. This is a long term trading method where the goal is to increase holding inventory in proportion to price advances. Instead of just looking for price advance to increase your portfolio value, you are also increasing the quantity on hand as prices rise.
Increasing position size in a loser can be good only if this loser survives and/or rebounds, otherwise, it can destroy your portfolio. Ask the long term investors in AIG for instance: how do they escape with their capital when they have a huge bet that has been increasing all the way down? They now have a major loss that may represent a high percentage of their portfolio and there seems to be no miracle that can save the situation.
Look more closely at equation 16 in the paper; it has two parts: one where the price has an exponential rate of return and one where the quantity itself is on an exponential growth rate. When combined, they will contribute to an exponential Sharpe (see also Figures 4 and 13).
Happy trading.
Size:
Color:
Hi Roland,
I understand and accept, conceptually, what you are saying. I am just trying to understand it at a concrete level, and to understand under what conditions is it valid. Or is it valid regardless of conditions?
Phase 1: Let's try an example, a step at a time. Let's say I have $10,000 and I start by buying 10 shares of A@$50 and 10 shares of B@$50.
Phase 2: One month later, A is at $60 and B is at $40, and I still have $9,000 in cash. Instead of buying the same dollar amounts of A and B, I buy 10 shares of A@$60 and 10 shares of B@$40.
So now, I have $8,000 in cash and 20 shares of A@$55 (avgCost) and 20 shares of B@$45 (avgCost).
I also realize that there are many solutions to your paper, but would the example I just listed qualify as one example of a solution?
- Ken
Size:
Color:
Ken,
QUOTE:
would the example I just listed qualify as one example of a solution?
No, not at all!
The method only buys on the way up.
The main reasons for why such a method works are given on page 39 of the paper. Technically, the method wins by default! By diversifying over 50 stocks or more, you almost guarantee that your selection will perform close to the market average. You also know that even if you tried hard, you could not select 50 losers, otherwise, you could be a “black swan”. Some of your stocks will have to outperform your average; you just don’t know which ones they will be, but it does not matter. You organize your portfolio so that progressively you make big bets on the winners and small bets on the losers. To do so, you feed the front runners and starve the laggards and dropping dead on the track horses. It’s your ability to change your bet size as the race evolves that gives you your edge. It’s the trading method itself which will turn an almost constant Sharpe ratio to an exponential one. Equation 16 is the heart of this methodology and it is part of a whole family of such solutions.
Happy trading.
Size:
Color:
Finally,
here is my new research paper and it’s free. It does take some time to write these things you know…
This one tries to reconcile my views with the Stochastic Portfolio Theory (SPT) and has for objective to transform the following stochastic differential equation:

The implications of this simple modification to an accepted theoretical stochastic framework can and do exceed established portfolio management precepts.
This new paper, just as the previous one, demonstrate that there is more than the Capital Asset Pricing Model (CAPM). In essence it says: you can design what you want to take out of the market and then let the market deliver on your terms.
Hope it helps you in designing your own profitable trading system.
Happy trading.
Size:
Color:
Hi Roland,
I have following your posts for a long time but seem to spend less time on the site lately.
How did your system/method perform in 2008 and so far in 2009?
Thanks,
Mike
Size:
Color:
Hi Reds, nice to hear from you again.
This is a long term trading method. That is where it excels; short term and daily price variations have little significance in the overall picture.
Let’s start from the worse case; meaning you start Oct 2007 and you find yourself today with a market drop of 50%. What happened using the method?
Well, it lost like everyone else. But just a little… You see, at first, when the portfolio is set up, only a fraction of capital is used (like 5%) and this is spread on the 50 or so stocks in your selection (you can even skip your initial bet and wait for incremental bets to occur with no initial commitment). As you can only purchase shares on the way up, you end up with very little if not no additional shares to purchase. Having lost 50% of your 5% commitment translates to a 2.5% portfolio drawdown as your worst case scenario. But most probably, the drawdown would be less due to stop losses kicking in. The method is very risk adverse: it starts with a small initial bet and then waits for proof of rise before committing more funds. Each incremental bet is done because there was a profit, a part of excess equity that can be used to improve long term performance.
Based on equations provided in the example, you know in advance how much capital will be required to execute your scenario, how many shares you will acquire and just how much profit it will generate. What ever your capital constraints, you can adapt as equations can be scaled to your own scenario. All you have to do is, once in a while execute a trade according to these equations as triggering thresholds are hit.
Size:
Color:
Hi Roland,
I understand that if you scaled using the beginning of the Bear that your approach would have done relatively well. However, assume you invested in 1997 and rode the market all the way up to August 2007, what happened from 2007 to present? Are you back to break even?
Thanks,
Mike
Size:
Color:
Hi Mike,
QUOTE:
Are you back to break even?
No. As prices went up, you accumulated shares according to preset formulas. You accumulated as long as prices were going up. Then, prices start to fall; the system goes on hold but the trailing stops are still in effect. The result would be that stops would kick in after a percentage decline letting you keep a major part of accumulated profits.
You are not trying to predict the market, but with your set of equations, you have predicted your behaviour to market price variations. And all you want is the money with as little risk as possible.
Size:
Color:
Roland...
This is fascinating stuff. Thank-you first for sharing your ideas, and secondly for answering all of the questions. I have to boil things down to the simplest element, so if you'll humor me, let me make sure I understand the system.
Assuming I have a $100M dollar portfolio, I might take a small percent of the capital (say 5% or in this case $5M) and spread it across N stocks where N is a sufficiently large number as to create a diversified portfolio. Then at the end of some defined time period, I would analyze the portfolio and allocate additional capital only to those stocks that had a positive return. Those stocks that had a negative return would not have any additional capital allocated to them and in some cases may have sold because of the trailing stop losses in place on all securities. Did I get the broad strokes?
A couple of questions now.
Do you suggest how often to evaluate the portfolio....Daily, Weekly, Monthly, etc - Or does the periodicity matter?
Do you suggest how much additional capital to allocate to the winners? Is it a static amount (5% of portfolio; or 5% of remaining cash) or do you use a scale (5% divided across stocks up 1 periods, 7% allocated to stocks up 3 periods, etc?)
Assuming there is a market crash and I'm left with a number of positions equal to N-75% because my stop losses bailed me out. Do you suggest how to get back to N positions. How do I add additional securities to the portfolio?
Again thanks for all of your help and I look forward to hearing from you.
Size:
Color:
TexasTiger,
QUOTE:
This is fascinating stuff.
Yes it is. Thanks.
QUOTE:
Did I get the broad strokes?
Yes. Absolutely. However, note that the method is driven by price.
QUOTE:
does the periodicity matter?
No. Not really, the method is not time driven but price driven. However, using periodical decision making would not make that much of a difference in end results.
QUOTE:
Do you suggest how much additional capital to allocate to the winners?
Yes. It is predetermined by equation (34) in the paper. You increase your position by the size of your trade basis which can be a constant, a time function or more preferably a performance related function.
QUOTE:
Assuming there is a market crash
Just as like in our current environment... you mean. You may have to execute small stop losses on a number of securities, but even if all your selections failed, your loss would be at most 5% of your total portfolio. For the stocks dropping to zero, simply replace them with new stocks which you think can prosper. It might sound crazy, but it is not that important that the one stock you may select survive. The point being that even if you tried, you could not select 50 stocks out of 50 that would go to zero. In my paper up to about 28% of stocks failed. So you make a few very small bets (relative to portfolio size) that you may loose, no problem there. We all make a lot of those. But the point is not there.
You are playing a game where if you average down and dip buy 10 positions at 10% per position on Lehman; you loose everything. And may I remind you that in our future, there will always be the possibility of a Lehman. Knowing this, you should not risk dip buying your portfolio to oblivion. You should look at the game as if it had an uncertain outcome, as if it wanted to eat up all your trading capital and leave you for broke. I personally think that the market is design to eat you up in less than 18 months. But you do not have to let it do that; you can fight, and on your own terms. You can tell the market: this is what I want. And when you deliver, I will take it.
By the way, your scenario starting with 100M and following the example in the paper would result, most probably within the 20 years time interval, in a portfolio valued at over 19B compared to about 672M for the Buy & Hold. And this not counting all the improvements you could apply to equation (34)…
Size:
Color:
Mike, here are some additional notes for you.
You have been looking for a decent system for some time now and I suspect that what you found was mostly disappointing. There are reasons for that: the game is never the same going forward, our forecasting abilities are rather limited and the way we play the game (the gaming itself) is often lacking long term perspective.
We play an uncertain game with an uncertain future. We are ready to try anything with a positive expectancy. That’s why we all test so many trading methods from short, medium to long term horizons. We try to find strategies that worked in the past and hope the same thing will prevail in the future… However, the future is always new; what prevailed in the past has little resemblance to what will happen 10 to 20 years down the road. Who knows which inventions or constraints will drive our Darwinian economy? Forecasting short to medium term stocks prices is not that easy; and when you study all those that try, you find out that, long term, they have a hard time beating the market averages; and you do observe that most don’t.
In my search for better systems I looked at the problem from a different point of view (from the end game and worked in reverse). The question being: that’s what I want, and now, what should I do to get there?
You design system after system and finally you stumble on something and investigate further, redesign and retest until you are satisfied with the results. In your search to simplify implementation procedures you then realize you can simply extract market profits following a deterministic binomial equation as in equation (38) in my paper which produce something like this:

Note that it is not the only equation of its kind, its part of a whole set of mathematical expressions that can preset your position sizing methodology. With this kind of equation, you predict, in effect, what you are going to do, not what prices are going to do. And this makes all the difference. In the case presented, the accumulated profits are a power function of price differentials; thereby transforming what has always been a linear function (Buy & Hold) into an exponential one. It’s all an achievement; no one has ever to date proposed an exponential Sharpe ratio. And yet, this
paper and the previous one proposes just that: a Jensen modified Sharpe ratio operating on an exponential curve.
Imagine, after years of research, you can finally express the outcome of your trading strategy with a simple power function. You want more performance; you can simply multiply by a scaling factor to your desired result which in turn will dictate the required capital to achieve your objective. Isn’t that the ultimate in simplicity?
My two papers need to be studied in detail; they contain all the ingredients to help you design your own and “improved” trading strategy. This should change the way you manage your portfolio and guide you to higher long term returns.
Happy trading.
P.S.: The best description I have found for this methodology was probably given by Will Rogers in the 1920s:
QUOTE:
“Don't gamble; take all your savings and buy some good stock and hold it till it goes up, then sell it. If it don't go up, don't buy it.”
Size:
Color:
Hi Roland,
Thanks for your papers and comments.
Have you coded the system & formulas you describe as a complete system within Wealth Lab or did you have to use another piece of software?
If you run it in the Simulator, how do you keep the profit/losses for each security separate so you only add to winning positions with its profits and do not add to losing positions? In order to sell a certain percentage of shares, are you using SplitPosition? I completely agree with the theory you have set forth but am not sure it can be coded & implemented in Wealth Lab.
Thanks,
Mike
Size:
Color:
Hi Mike,
QUOTE:
Have you coded the system
Presently, my latest version is under Excel (some 3,000,000 cells with interdependent formulas). However, I operate it on manual. Like I’ve said before, it is a boring system. It has spurts of trading and then can wait for awhile with a trade here and there. Nonetheless, it has for long term objective as a minimum to follow the equations set forth in my previously quoted papers.
The method trades in round lots, accumulates shares or executes a stop loss. I have not designed a partial or scaled exit yet. My first objective was to have a system that worked, not to have all the bells and whistles.
The papers should serve as a theoretical backdrop to developing your own system with your own improvements. It was part of my motivation to make it public. The mathematical formulas explain what was and what will be; but, they have little predictive powers. They provide the best explanation for describing what is happening within a mathematical framework.
The whole concept has for origin a simple idea: use part of the accumulated profits to increase your share position, the same way dividends are reinvested. From there, the following formula starts to explain what has to be done (see equation 31 in last paper).

By having the quantity of shares and the price compound over time you can outperform the Buy & Hold strategy easily. This, in turn, leads to an exponential Sharpe ratio as the only performance explanation. Within the Capital Asset Pricing Model, exponentiation can not come from the risk free rate, beta or the average market return. Either you add a new term or you modify an existing one. I opted to modify the Jensen alpha as it was already an interpretation and measurement of skills brought to the game. The Sharpe ratio goes from near flat linear to exponential making your portfolio the product of two exponential functions.
What ever you do that’s in line with the above equation will increase your long term portfolio performance. And as the paper demonstrates, you could even design a betting strategy to extract what you want from the market. You need to think about it, break down the desirable traits you want your portfolio to have, and then design the procedures that would implement your long term goals. The secret, if there is one, is in the position sizing: the incremental betting system that lets you increase your position as price increases.
Size:
Color:
Looking for a total solution.
Over the past 5 years in this forum, I’ve advocated the use of a total solution in order to improve portfolio performance. I’ve provided two research papers to make my point, trying to present my views on the subject.
Here is what I think a total solution should look like:

From this formula, you should notice that the old Buy & Hold strategy is not dead; it has only been improved to accept an exponential Sharpe ratio by accepting to trade over the stock accumulation process as described in my two papers.
The funny thing in this research, for me, was that the number of trades done had significance. In this formula, you gain by holding for the long term rising stocks, you gain from your long and/or short trading edge and you gain by writing options on your long term holdings.
As I have said before, I do not believe in simple strategies. If trading strategies could be simple, we would all be rich beyond our wildest dreams. After all, we got the brains, we got the tools, so we should get the money, right.
Here is rest of the explanations (go to the latest update).
Size:
Color:
What about the sum of profits from the open shorts?
This is not the same as the total interest on the principal from initially selling the short, because the open short position has its own profit/loss just like the open longs.
The alpha accelerator seems like a double edged sword. How does one know they are compounding alpha in a positive or negative manner? (Many times one might not know until the trade is over.) The same can be said for taking any long or short position, since we do not know the final outcome, other than a long term bias to upward drift/inflation.
Just a general observation, nothing to do with Alpha Power. I find it fascinating that some of the most naive strategies can be 50:50 outcomes, so much so that even the worst strategies can also net positive results. That's why I like my Dartboard. ;-)
Regards,
--Mike
Size:
Color:
Hi Mike,
The strategy has for core a long term stock accumulation program on which short term trading (long and short) plus option writing is permitted in order to better use available excess equity.
The method starts with small bets (5% total, and its optional, which means that at least 95% of capital is available for trading) and then waits to buy additional shares on the way up. Thereby, “compounding” alpha can only be positive. For the stocks that do not go up, no additional shares are acquired and the small bets you already have (at 0.1%) may be simply stopped out should the decline get too severe. For the stocks that have gone up and where you have accumulated additional shares (price had to go up first), the trailing stop loss is designed just for that; to preserve as much as possible of this gain (again with positive alpha). This way you are making bigger bets on profitable trades and much smaller ones on losing trades. Review both papers; they are quite explicit on this.
It is mentioned in the article why long term shorts are ignored. And in twenty years time, the short term opened shorts will represent only a very small fraction of still opened positions. I considered them to have too small an impact to include them in my design. Note that I did not include the still opened short term longs either for the same reason. But, to be correct, they should be included.
QUOTE:
That's why I like my Dartboard.
A dartboard is good. The Alpha Power paper is all based on randomly generated price data with no notion of the final outcome
QUOTE:
other than a long term bias to upward drift/inflation.
which is the foundation for this equation.
No matter what you do trading, it will be “all” or “part” of the equation presented. The points that I am making are: pyramid in the rising stocks for improved long term performance. What ever edge you have trading, scale it up as profits pile in. And with a positive edge, by all means, try to execute as many trades as often as you can within the limits of your equity curve. Note that my equation says all of that and more.
If you study all the implications of my equation, you will find a highly sophisticated structure with very simple execution methods. It could all be done with pen and paper (I currently use Excel, but any tool will do).
If you take out the volume accelerators from the equation, you will be left with the classic portfolio equation which states that the average profit per trade times the number of trades is your total profit (I’ve presented such an equation, here, some 4 years ago). The innovation it my formula are the volume accelerators which solves many portfolio problems.
Portfolio management has seen many methods trying to optimize performance: Kelly number, optimal-f, fix ratio, fix amount, variable ratio and many others. But most have a deficiency or other. The Kelly number and optimal-f presume that your win rate is constant which is not the case. The fix ratio and variable ratio tend to get too risky as all trades are not created equal and should not be treated as such. The fix amount will underperform as the portfolio grows.
So with one small “innovation”, - the volume accelerators – you solve all those questions in a single swoop. You let the market decide who will survive and thrive. And your Darwinian approach, where you feed the strong and starve the weak, will make this a performance reinforcement method that will outperform the market itself.
Size:
Color:
I'm pretty sure this won't work any better than just buying the index. Your premise is buy high, sell higher, short low, cover lower. By weighting entries relative to the moves in price, where up moves get larger weights, down moves less, this is the exact same methodology of index funds. Just by that, you should know it's not going to work, and certainly not because of any predictive power but due to the upward drift in your equations. The situation is even more pronounced, as you've essentially assumed you can keep buying higher and higher and selling lower and lower. This is essentially an up market system, and very similar to sharpe ratio optimization strategies discussed in the R forum on wl4.wealth-lab.com. Furthermore, stocks aren't random. They are correlated with market trends, and without some functionality for market trends, impossible to achieve a viable backtest.
You also seem to imply that your profits can be described by a quadratic formula, or a j-curve, since stocks are logarithmic with values greater than or equal to 0, with the minimum at a theoretical point that has no intuitive or practical application.
Can't wait to see your market calls roland. You'll see positive upward drift in the NAZ100 if you really wanted to apply your theory, but without the price moves calculated based on market correlation, I can't see that working.
I would try to focus on "how" to generate profits, rather than on what to do when you have them. I seriously doubt this will even come close to outperforming an index, and if it does, certainly not even close to 10%, no matter which one you pick to be your benchmark. The strategy is not reactive enough to outperform.
Size:
Color:
I didn’t think some would have such a hard time understanding this. So, I’ll put it all on a common sense point of view.
The method has two components: the main one accumulates shares for the long term while the other accepts short term trading (long and short). And since you are accumulating shares to hold for the long term, might as well write options on those. Idle cash can bear interest. All this is expressed in the formula provided.
The primary function of the method is to accumulate shares: funds, indexes, ETF, stocks; what ever, you make your pick. Technically, it could be “any” marketable asset that appreciates in time. And since you are trying to accumulate for the long term, might as well select stuff that you think might “live long and prosper”, meaning that you expect, long term, the price to go up.
QUOTE:
This is essentially an up market system
Yes, I have never said otherwise. Over the past 200 years, for the US market, there has not been a single rolling 20 year period that has had negative returns. The bet that maybe in 20 years time, stocks, on average, will be higher than today has a probability that approaches 1 asymptotically. Like getting close to a sure bet, but with no guarantees. It is not because it never happened in the past that it will not happen in the future. The market has shown examples of this time and time again.
Now say you decide to adopt “this” trading method. For the accumulation side of the equation, you could just Buy & Hold (equivalent to the quantity accumulation rate being zero). If you buy an index, an index fund, an ETF and just hold, you become that fund or index. Your expected return is the fund’s or index’s expected long term return. We should not be surprised with this, should we?
QUOTE:
where up moves get larger weights, down moves less, this is the exact same methodology of index funds.
By the way, an index fund imitates an index by definition. This means that, at all time, the weights of the stocks in the fund will be proportionally close to the weights of the stocks in the index. If the composition of the index does not change, the index fund managers have nothing to do. If the index fund has an inflow (outflow) of cash, they will sit idle or buy (sell) stuff, in accord with the market weights. Therefore, they will buy on the way up only when there is sufficient cash inflow and if the market is moving up at the time. Their turnover is very low (little trading, they are of the Buy & Hold trading philosophy) and that is also the main raison why their expenses are low (not much to do).
Having started this “accumulation program”, you also decided to use part of the generated paper profits to progressively buy more of your current holdings as prices are moving up. This does not change the underlying price of the stuff you bought, its progression in time will be the same that you buy more or not. You are kind of doing quasi-random time-volume-price slicing of your trades (I won’t go into this, don’t worry). Nonetheless, having bought more on the way up, you will end up with a greater quantity on hand in the end. And that is the first part of the equation. The price appreciation can be seen as a compounded rate of return; and having the generated profits follow the price you can opt to accumulate additional holdings at this, or at a fraction of this, growth rate. Your trailing stops will transform some of your intended longer term trades into shorter term trades which should keep a major part of their accumulated profits (at least, you should design your trading procedures to do just that).
So what should you expect? To simplify things we’ll say you buy a single index fund. As time progresses, you accumulate at the index’s rate of appreciation. Long term (20 years) the price should have appreciated somewhere close to 10% rate and the quantity on hand at about the same rate. Twenty years at 10 percent per year under the Buy & Hold will be 6.73 times your initial holdings. And having the quantity increase in time at the same rate will also bring in a factor of 6.73 times your holdings. So to resume, instead of having a 6.73 times your initial capital after 20 years in the game, doing nothing but holding, you get 45.26 times your holdings for once in a while buying some more stuff of the stuff you already own as its price is going up. It is not that you will make 6.73 times your capital; it is that you will make 6.73 times the 6.73 times your capital! It is the same result as making 6.73 times the Buy & Hold and is equivalent to a 21% return on your initial capital. Those pennies sure do add up. That’s the power of compounding over long periods.
QUOTE:
Your premise is buy high, sell higher,
you've essentially assumed you can keep buying higher and higher
So it is not buy high, sell higher. It is buy, buy higher, buy higher, continue to buy higher and never sell if possible. In essence, you adopt Buffett’s preferred holding period which is “forever” with the twist of increasing your position in time. This resumes the first part of the equation.
QUOTE:
I'm pretty sure this won't work any better than just buying the index.
It is not that this won’t work any better than just buying the index; it is, even if you buy an index, simply by reinvesting part of the profits in additional shares, you will outperform the index by a factor equal to your quantity accumulation rate. This is no different from reinvesting dividends. It is only that you systematically apply it to accumulate a larger quantity of the stuff you started with as it goes up in price.
QUOTE:
and certainly not because of any predictive power but due to the upward drift
Buying an index, you don’t even have to make a prediction of where stocks are going, you know that long term (20 years +) probabilities are on your side that, on average, the price should be somewhat higher: by how much, who knows. I have not seen anyone, or any machine, able to answer that question. But if the trend continues as is (with its 200 years history), you should expect an index rate of appreciation somewhere around 10%. It is the highest probable outcome. Can it be something else, sure and with high probability, but it will still tend to 10% from either side.
The short term trading part is just that: a short term trading method. It can be any method you wish having a positive expectancy. There is no need to trade if you can’t generate, on average, a profit. So this is simply: buy (short) whatever, for what ever reason, and sell (cover) higher (lower). The profits generated are pumped back into the long term holdings which will increase further the portfolio’s rate of return. Should your trading produce, on average, 10% return per year (which is low) on your portfolio, and you pump it back in to acquire more shares for the long term, your inventory rate of increase will be about 20%. And this will translate into an overall 32% return on your initial investment or 258 times your initial capital. Again, those pennies do add up.
On the trading side, I recommend starting with small bets that you can increase in time based solely on the profits generated. There is no need to increase the bet size should you not have a real edge. That’s what the trading formula says. Once you have established your positive trading edge (long and/or short), you can increase the volume and/or increase trade frequency. Again, that’s what the formula says. Either way, you are boosting your profits upward.
You play small bets because the market has a tendency to throw you a curved ball here and there. There is always a Lehman or a Madoff somewhere. There is always a WorldCom, an Enron or a Refco cooking in the background and you never know when one of those will be your preferred high percent of portfolio buy on the dip kind of thing. And having a big bet on one of those can destroy your portfolio and put you out of the game. So you place smaller bets as the most basic measure of preservation and portfolio protection. It’s the same reason you accept stop-losses as a form of portfolio insurance cost. It is preferable to pay a lot of small insurance fees in order to avoid the big drawdown on the big bet with no other recourse than accept a portfolio wipeout. I can’t put more stress on this than that, we play a treacherous game where on a hundred trades we can make a profit and then on a single trade lose 80% of the portfolio. The risk is too high. I’ve seen people blow up their entire account on just a single trade in a single day.
The more your trading edge is secure, meaning that it holds in time, the more you can increase the volume (the bet size). And what ever constitute your edge, should you only participate in a fraction of the time this edge occurs, then you can increase your participation by taking more of such trades. Should you deceive yourself in backtests by doing over-optimization, curve fitting, or outright peeking, you will find out, at your own expense that the market does not fool around. From my observation, it has always been ready to massacre any delusion one might have.
All this is pretty simple and that is what the trading equations say: make as many small bets as often as your trading edge permits and let the size of your bets grow according to the profits generated. Naturally, at all times, these bets must be marketable and should be kept relatively small compare to the total portfolio.
As I’ve said in the previous post. No matter what you do trading, it will be “all” or “part” of the equation presented. Should your preference be to trade short term on the long side only, then only that part of the equation applies to you. The rest has zero value; if you do not hold long term positions, how can you have long term profits? Should you always make the same bet, then the rate of increase for the bets is zero. So your outcome is entirely governed by your average profit per trade, your constant quantity (bet size) and the number of times you can make such a trade. That’s fine, the equation still holds.
However, for those wishing to outperform the indexes, you have an equation you can follow where your decision process comes into play. On the long term side, increase the volume and let the market pay for it (my two papers are quite elaborate on this). On the short term side, find your edge and trade it as often as you possibly can and as it generates profits, increase the size of your bets and the frequency if you can. Then take part of the generated profits to buy more long term holdings; all this within the limits of your available equity at the time. It’s a long journey, twenty years long or more.
P.S.: When you look at Buffett’s long term record, you can’t help but notice that he is following all the components in the equation and more. His preferred holding period is forever. He does use a trailing stop. He has made progressively bigger bets in time and he showed he could scale into his positions over months, even years, to outright buying whole companies. He’ll take side bets, short term bets where he knows he has an edge and pump his accumulated profits in new purchases. Yet, he can withstand 50% drawdowns with a smile knowing that long term, the market is on his side. His latest bet is a big one: he just bet the farm that in 10 years the market will be higher than today and I have to agree with him. He should make very good on this one.
QUOTE:
You'll see positive upward drift in the NAZ100 if you really wanted to apply your theory
Yes, definitely.
QUOTE:
The strategy is not reactive enough to outperform.
There is absolutely no need to be reactive. You just apply the formula.
QUOTE:
I seriously doubt this will even come close to outperforming an index
QUOTE:
but without the price moves calculated based on market correlation, I can't see that working.
The price moves do not need to be correlated to the market; they are the market due to the excessive diversification used.
So to me, the whole equation, simply expresses what we can do to optimize performance within the constraints of the account size and the game itself. It is not by adopting the Buy & Hold strategy or only trading your way to a higher portfolio value, it is by doing both and with volume accelerators that you can definitely outperform, and in a big way, the market’s expected long term averages.
On a lighter note, I’m reminded of the following quotes:
“Don’t worry about people stealing an idea. If it’s original, you will have to ram it down their throats”. by Howard Aiken
“Under capitalism, man exploits man. Under communism, it’s just the opposite”. by John Kenneth Galbraith
Size:
Color:
Just go dollar cost average in. There are systems that predict price moves over the short term. Out past a month, no. But shorter time periods from maybe 1-2 weeks, yes. I think you're too focused on what to do when you have the profits. Getting them should be a higher priority, and buffet certainly doesn't invest this way. His fundamental analysis is what gets him his outsized returns, that, and overweighting some of his investments beyond an average portfolio manager's weights of 5%.
Size:
Color:
QUOTE:
Just go dollar cost average in.
A small part of the method actually does a form of averaging in. However, it is mush more elaborate than just a simple dollar cost averaging. I’ve said in the previous post that: “You are kind of doing quasi-random time-volume-price slicing of your trades (I won’t go into this, don’t worry)”. And I won’t this time either.
QUOTE:
There are systems that predict price moves over the short term.
If this was in fact the case, anybody with such a system starting 40 years ago would now own the entire market. And there would be no trading. Those that make it big have long term holdings and therefore are “holding the bag”. However, you are right; there are a lot of systems that predict prices over the short term. But in this game, it is not the quantity of such systems that matter; it’s their forecasting accuracy. And there, their record is not that impressive as most don’t even beat the Buy & Hold. And not beating the Buy & Hold is the same as having no ability whatsoever at predicting where prices are going.
QUOTE:
I think you're too focused on what to do when you have the profits. Getting them should be a higher priority
You need to look at the total picture. This is not a game you play for one or two weeks. I’m focused on trading methods which in the long run will be not only profitable but that will not blow up in my face as some of the high percentage of portfolio dip-buyer programs I see on this site. In all the series of trades you might do in the next 20 years, if ever a single one of those trades is a “Black Swan”; you might be out of the game. And I believe that the probability of touching one of those is relatively high; at least I am not going to gamble that I will be able to avoid all of them. I prefer taking measures to protect myself in case it happens. You can only bet the farm on an almost sure bet. And taking multiple positions (where you bet most of your portfolio) on a downer is certainly not it.
QUOTE:
and buffet certainly doesn't invest this way.
Now let’s see what I’ve said concerning Mr. Buffett’s investing methods.
1.
His preferred holding period is “forever”. This is one of his famous quotes. When he says this, I simple believe him. And when one takes a look at his record and holdings, he has the impression that he might still hold on to his positions for some time.
2.
He has made progressively bigger bets in time. Well, yes. His portfolio has been growing in time and for quite a while now. He did not start making 5 billions dollars bets; he started a lot smaller.
3.
He showed he could scale into his positions over months, even years, to outright buying whole companies. When you are big and don’t want anybody to know what you are doing, it becomes a necessity to scale in a big position over time; otherwise, someone, somewhere, may front run your trade. You try as mush as possible not to show your hand. And another way of not showing your hand till the last minute is to buy the company.
4.
He’ll take side bets, short term bets where he knows he has an edge and pump his accumulated profits in new purchases. Well, yes. That is his speciality. His experience and know how of the markets let him pursuit any of the opportunities that is presented to him. He has said many times that he reads over 200 annual reports a year. And having at times a big cash hoard, he will in fact buy more of what ever he deems might be profitable in the long or short term.
5.
Yet, he can withstand 50% drawdowns with a smile knowing that long term, the market is on his side. Again yes. As a matter of fact, he just did. Mr. Buffett has practically no interest in very short term price variations. He looks at the big picture; where his investments will be 10, 15 and 20 years down the road. And he already knows that the profits generated by all his businesses will serve to buy even more shares in the future.
So, I don’t see how you could disagree with the statements I’ve made concerning Mr. Buffett’s trading methodology. It is all common sense, very common sense: he is doing his best not only to preserve his portfolio but also finding ways to make it prosper within his own constraints of size, risk and available market opportunities. He has shown over the years, time and time again, that he could balance all of this with ease. I can only applaud him for his outstanding achievement and endurance.
QUOTE:
His fundamental analysis is what gets him his outsized returns, that, and overweighting some of his investments beyond an average portfolio manager's weights of 5%.
There is nothing in the formula presented that says anything against fundamentals. On the contrary, the first part of the equation deals with long term investments and recommends that you find stocks that might “live long and prosper”. This is not done by rolling the dices.
The formula presented is a mathematical model for trading. What ever anyone’s trading method may be; it can be expressed using that formula. That you trade long, short or hold forever; the equation will fit your trading style. Going against this equation is like saying that: quantity time price is not equal to the holding value of your stock (not QP=V). Well I certainly have to differ with you. This is so basic, that everyone: Buffett, hedge, index or mutual funds, banks, individuals, and myself included, all have trading methods that can be expressed using the equation presented. That some don’t use part of it is their prerogative, but the part they do use is expressed in the formula, that it be profitable or not. That they use volume accelerators or not does not change the equation but it could certainly improve their performance if they did. The formula is just that, a mathematical equation.
Instead of expressing your “opinion” on this thing can’t work; why not put up the math and prove that it doesn’t. I find it hard to argue on the merits and the validity of an equation when all it does is express 2+2=4. To complete a trade, you need to open and then close it at a profit or at a loss. You make many of those and you can average the results. Is this what you are objecting about, or is it simply me?
Nexial_1002002, at first, I thought not answering your latest post as this exchange is leading nowhere. You seem bent on misunderstanding what is written, expressing an opinion without providing any concrete basis as if just expressing anything at all validates your statements. Consider this my last reply to your “opinions”. In the future, I will simply ignore your comments. I am not in the business of educating you and I don’t need any aggravation in my retirement years. I’m just happy helping my close friends profit from my research. May I be so bold as to suggest you re-read the two papers and try to understand that the equations presented are just that, expressions of very simple concepts. From the questions you expressed to the statements made, I think you might need to study the financial markets a little more, and in this regard may I suggest that you read a few books on the market in general; this might help you gain a better understanding of the markets, its basic math and then go on from there to more elaborate market studies. Should you wish to have a list of such books to read, I’ll gladly provide one. By the way, I would start by trying to write Mr. Buffett’s name right.
“What counts for most people in investing is not how much they know, but
rather how realistically they define what they don't know. An investor needs
to do very few things right as long as he or she avoids big mistakes.”
1992 Letter to Berkshire Hathaway shareholders
"We don't get paid for activity, just for being right. As to how long we'll wait, we'll wait indefinitely"
1998 Berkshire Annual Meeting
Size:
Color:
HERE is another interesting study. It tries to find a mathematical model for daily stock prices at the 5-minute level. All should recognize the u-shaped volatility curve exhibited during trading hours. The paper presents the case where the data should dictate the structure of the model and where the model, while not perfect, should capture and explain most of the daily fluctuations.
The authors conclude that with their view of the data structure, and accounting for data seasonality, prices have a near Gaussian distribution which is another way of saying that prices at the 5-minute level are quasi random.
Faced with such a conclusion, one should (at least at the 5-minute level) adopt more closely a gaming strategy with all its implications.
Size:
Color:
Roland,
I recently read Ralph Vince's The Handbook of Portfolio Mathematics and it reminded me of your work. I believe you mentioned that one problem with optimal-f -- and, by extension, the leverage space portfolio model -- is the time-varying distribution of the game we play. I've been trying to find ways to deal with these changing distributions; but your work has given me pause and re-ignited my imagination.
Is there any reason your work could not be extended to asset allocation, or a portfolio of trading strategies?
Thanks again for sharing your efforts!
Size:
Color:
Hi Bodanker, nice to hear from you again.
QUOTE:
Is there any reason your work could not be extended to asset allocation, or a portfolio of trading strategies?
Simple answer: None on both counts. The method deals with any asset where there is a plentiful supply and that can appreciate long term. You could treat any portfolio strategies as single stocks, indexes or fund of funds. The method is very risk adverse and has over-diversification as backdrop.
Optimal-f works on the grounds that you know your future profit distribution (based on your backtests!!!) and that this distribution is Gaussian in nature which it is not. There lies the weakness of Optimal-f, which is the same problem faced by the Kelly number. I do not know what my hit rate will be in the future and I have no way of finding out.
My method does not know the future price of stocks, or the future hit rate for that matter and it does not care what the future distribution will be. It operates on a relatively simple formula (given in the papers) where all the stress is put on position sizing with reinforcements.
Where most papers elaborate on efficient markets, growth optimal portfolios and efficient frontiers; my papers emphasis that you can jump over these limitations by reinforcing your positions in the best performers of your selected assets while starving your worst performers.
The result will be that what ever your selected assets, your portfolio weights will be in the same order as their relative performances. This in turn means that, in the end, you will have made your biggest bets on the assets with the highest returns while having your smallest bets on the losers.
Good trading.
P.S.: Hope this will re-ignite your imagination as there is much to see on the other side of the efficient frontier. On this note, you should see what I’m working on these days. I’ll provide something out soon.
Size:
Color:
QUOTE:
Optimal-f works on the grounds that you know your future profit distribution (based on your backtests!!!) and that this distribution is Gaussian in nature which it is not.
I wouldn't say it "only works" if you know your future distribution, but it is "only optimal" if your future distribution is equal to your historical distribution. And optimal-f doesn't require your profit distribution be any particular shape, let alone Gaussian. E.g. many of Vince's examples use a binary distribution. It does require your distribution have a positive mode, however.
This certainly re-ignites my imagination. I've been thinking about it a lot. Until I remembered the zero-drift results, I thought your process simply searched-out the stocks with the largest positive drift. Those results show that it will do so
as a result of its rules, but it's not a necessary condition.
Best,
Josh
EDIT: I look forward to seeing what you're currently working on!
Size:
Color:
Hi Josh,
Yes, I agree with your position on Optimal-f.
However, I do think that Optimal-f does “assume” a binary distribution which in turn is a “normal” or Gaussian distribution. And as you said, it will be optimal only if your future distribution is equal to your historical distribution. Now this historical distribution, should it come from backtesting will suffer from all the inherent problems due to over-optimization and curve fitting to the point where it should be considered unrealistic to rely on the “found” historical distribution. And thereby, one is left with the same quandary: what is my optimal bet size, not only for one stock over one period, but for all stocks or assets in my portfolio over the whole investment period? And I think that this is where the fun begins.
Good trading.
Size:
Color:
Hi Roland,
I like your paper a lot!
A question about this drift thing that has gotten a few posts already. It is very interesting that you managed to achieve positive alpha in the zero drift scenario, which I would love to hear more about. Though regardless it seems to me that you are making a very critical assumption in your theory that has an impact on your estimated performance.
I'd be very happy if my interpretation of this is wrong, but as I've understood it the drift component of a stock is being determined randomly at start and then not touched again (?). By doing this you have actually created an opportunity which you later capitalize on by adjusting portfolio weights as this underlying direction slowly unfolds. If this is correct then this is an edge that is only applicable in your simulated environment (as stocks have a behavior that is different in my studies, and regardless of my studies it is an assumption that needs validation if this is the case). Also this would mean that your condition of random dataseries is practically incorrect.
I understand that the market as a whole appreciate over time and that you can generate random data without violating the assumption of aggregate positive drift of 10%. However I have yet to see facts that individual stocks in general maintain the same underlying direction (drift value) over 20 year periods. Of course, if you would do a linear regression of a stock it would always return a linear trend, but that doesn't mean that the trend (drift) observed for history would apply for the future. The drift value of an individual stock is random, yes, but the duration of the drift should be so also with the condition of randomness. To make it "truly" random I suppose changing the drift on every price change would be right, with an average of 10% drift for all stocks aggregated to mimic the market.
I also have another observation, from watching Figure 6, that I would like your comments on. The standard deviation seems to not be scaling with price appreciation - meaning that the stocks that are on top experience less noise, in percent, as they progress (and a lot less noise than we/I percieve in the market).
Keep up the good work.
Sincerely,
Christian
Size:
Color:
Hi Christian,
QUOTE:
as I've understood it the drift component of a stock is being determined randomly at start and then not touched again
Right. It is only used to create the data series.
QUOTE:
By doing this you have actually created an opportunity which you later capitalize on by adjusting portfolio weights as this underlying direction slowly unfolds.
No. You would be right if the trend was followed as the underlying direction unfolded. However, none of that information is being used as it would be a form of peeking which would certainly reduce the method’s value. This point is addressed in both papers. Peeking, curve fitting, over-optimization, biased stock selection, biased investment period, price forecasting and survival bias avoidance were all put aside as a consequence of adopting randomly generated data series. No forecast is being made out of the ongoing accumulated data.
QUOTE:
with an average of 10% drift for all stocks aggregated to mimic the market.
Yes. The 10% drift is the average for the whole portfolio as an attempt to mimic the market. Portfolio over-diversification tends asymptotically to the long term market average, performance wise. Each stock followed its own course. There was no way of knowing in advance how an individual stock would fluctuate or behave in time. All you knew was that the average drift might tend to 10% on average for the whole group of stocks and as such would approximate the secular market average. Note that within each test run, some 28% of stocks could fail. And there was no way of knowing which ones would and no way to avoid them.
The data series were composed of the drift, (about $0.02 per day) to which was added 3 random functions in order to mimic a Paretian distribution. The method used was to add three Gaussian distribution with increasing sigma and decreasing probability of occurrence; thereby generating a relatively close approximation of a Paretian distribution (generating fat tails with low probability). If you took out the drift, you would be left with a purely random distribution with fat tails and with an expected mean of zero as you would expect.
QUOTE:
and a lot less noise than we/I percieve in the market
Yes, I partially agree with this. There is “less noise” as time progresses and in both direction ‘up and down’. In all the tests, no highflier could ever develop by design whereas it was relatively easy for a stock to drop to zero. While designing this methodology I added several controlling factors which in aggregate were scalable; you wanted more performance, you simply turned on the volume and supplied the required capital. I deliberately reduced overall performance by excluding highfliers in order not to show too high portfolio returns. This in turn reduced volatility.
QUOTE:
To make it "truly" random I suppose changing the drift on every price change would be right
The drift is too small to have any impact. It is literally drowned in the noise. With the random series used, shifting such a small drift randomly would not have deviated much (like very very little) from the obtained regression lines or even made a difference in the outcome for that matter.
Interesting questions and thanks for your nice comment.
Good trading.
Size:
Color:
All right, that's enough of verifications for me to invest more time in the analysis of this concept.
It may be much to ask for, but I'd be glad if you gave me a hint when/if you produce something new. You can reach me at this address, [*].
Thanks for explanations and the generosity with your ideas.
* EDIT: Will check the link for updates. :)
Size:
Color:
The following
link points to what I’m working on right now. It is not complete and should be considered as a work in progress especially that it stops where I think it starts to get interesting. The rest will be coming soon (a lot of verifications to do). However, you will see where I’m going. It is a follow-up to looking for a total portfolio solution.
I was sidetracked last month when I uncovered the referenced 2000 pre-print of Schachermayer. I found it fascinating in its strategy modeling simplicity that I naturally wanted to fit my own model in what I think is a simpler model for a total trading strategy as it all boils down to a two symbols matrix representation.
Schachermayer’s lecture notes also make, in my opinion, an accurate and proper account of Bachelier’s ground-breaking 1900 thesis on speculation (see reference in the link).
Good trading.
Size:
Color:
For those that might be interested in this sort of thing, here is the next section on
Position Sizing. It looks for a total solution to the portfolio optimization problem.
What I wanted to do was elaborate a trading strategy that would out-perform the Buy & Hold. It is from the result obtained from tests where I needed a logical explanation for the observed data that these formulas were elaborated. They served not only to understand what was going on in the trading procedures but also to verify that the obtained results were mathematically plausible. Removing the inventory growth rate naturally returns the pay-off matrix to its Buy & Hold origin.
I hope it can be useful to some.
Good trading.
Size:
Color:
This new installment was supposed to be on the implementation of the alpha trading strategy. However, as I was writing it, other notions surfaced and the whole thing morphed into decision surrogates; the elements that deal with the trading decision process. I think it is interesting in its own right as it enables to treat every stock on an individual basis with all its idiosyncrasies. Not only will the price series have a unique signature, its trading counterpart could have one as well.
Is presented in:
An Enhanced Pay-Off Matrix the elements that can affect a trading decision within a total portfolio optimization problem context. A search is made to enhance long term portfolio performance using relatively simple principles like profit reinvestment and positive reinforcement. The goal being to make the biggest bets on the biggest winners while making the smallest bets on the losers without knowing beforehand where each stock price will be 20 years from now.
Hope you enjoy.
Good trading.
P.S.: This is closely related to the other documents already provided.
It starts with:
Looking for a Total Solution; was followed by
Another Trading Model which led to
Position Sizing. All these documents cover the same subject which is trying to find better long term trading strategies.
Size:
Color:
HERE is an interesting paper .
It deals with optimal trading strategies for placing block trades, and since a little bit more than 50% of trading on major exchanges are of this type, it is not a bad idea to learn these concepts as they apply to the market we trade in.
Is shown in this paper how big institutional blocks are sliced and diced for execution during the trading day and how they impact the price discovery process itself. The objective is to find the optimal way to execute a big block without unduly affecting price. It is all about position sizing and scaling into a trade at the lowest cost possible.
Hope some find it useful.
Size:
Color:
I don’t know if anyone realizes the importance of the study mentioned in my previous post.
Below is a capture of block trades for FAS today. Every 31 seconds or so, with a small drift of 15 seconds in an hour and a half, a 10k to 100k block changed hands, just like clock work. This behaviour accounts for over half of FAS’s traded volume. It is easy to observe on the time and sales or on a one to five tick chart. You can’t detect this on a one minute time frame.
It is 11:20 as I write this, and the process has been going on since 9:30 and the trading volume is at some 18.5M shares.
This is not what I call random movement or random execution. It has to be orchestrated and computer driven. But still, this is what we trade against. We become the noise traders or we understand how prices move.
If your time scale is one minute or less, you should be interested in studying the phenomenon more closely.

Good trading.
Added later. (16:11)
The above behaviour lasted all day to the very last minute of play. These blocks accounted for over 70% of today’s volume of 48M shares. Only a computer program having access to Level III could do the job.
Size:
Color:
HERE is a recent study (2009) by renowned Fama and French.
They conducted a performance study on over 3000 actively managed funds over a 22 year period (1984-2006) and came to the conclusion that most funds (over 80%) failed to generate positive alpha and even had a hard time just covering trading expenses. Their study thereby state that the long term expected alpha tends to zero and that it is very hard to distinguish skill from luck in actively managed funds. I do agree with their findings.
The implication of their study is simple: it is that the thousands of professional money manager having the most sophisticated hardware and software at their disposal failed to outperform a low expense index fund or the simple Buy & Hold. And for the very few that generated alpha, they produced low values of alpha, moreover, you could not pick them out of the crowd.
Therefore, based on this study, actively managed funds (meaning trading as we do) have a low probability of exceeding the Buy & Hold strategy over the long haul; which further implies… (what ever your own conclusions).
On the other hand, I have tried to show (in this thread) that not only is it possible to generate positive alpha, it can also be controlled by deterministic equations. The difference lies in how you see the game and how you wish to play the game. As a matter of fact, should you remove the scaled excess equity buildup reinvestment process from my equations, you would be left with a Buy & Hold strategy.
Hope it is helpful to some.
Good trading.
Size:
Color:
HERE is my latest research paper: “The Trading Game”. It is for the few that have followed this thread and were wondering where it all led to.
It is a continuation of the preceding papers. It maintains and re-emphasizes what was presented and leads to part one of my conclusions. The more I researched the subject, the more the equations I used expressed simple trading methods which could all be resumed in: trade the Buffett way. All the equations represent in mathematical form what Buffett has been doing for years with a lot of success. Buy what you think will be there in 20 years time. Take your initial position and accumulate more shares as profits increases. As a matter of fact, buy more shares could be in anything you think will appreciate in time; any asset with a future higher value will do.
Hopefully, this new paper will help someone.
Happy trading.
Size:
Color:
Hi Roland, this is a fantastic thread about your Alpha Power research. I stumbled upon it about three weeks ago and feel like I am coming late to the party. I started working on generating the random data first so I could run similar tests without using real stock market data.
I have a few question about the data generation:
1. Regarding the generation of the Error portion of equation 1 in your Alpha Power paper, I thought I was creating a Gaussian distribution of 3 standard deviations. However, I am not sure what your 8/13/2008 post really means. It states
QUOTE:
As I wanted random fluctuations to behave in a Paretian manner rather than Gaussian - which would have been a normal distribution - I had to simulate a Paretian distribution. The trick used was to add three Gaussian distribution with increasing sigma and decreasing probability of occurrence; thereby generating a closer approximation to a Paretian distribution (generating fat tails with low probability).
Any hints on how to implement it?
Is this a clearer way of stating what this means? I added the following words in italics.
QUOTE:
The trick used was to add up to a three Gaussian distribution with increasing sigma and decreasing probability of occurrence across the set of 50 symbols of stocks prices, as opposed to within a single symbol
2. Are you factoring in compounding to your annual 10% drift increase? Figure 7 looks pretty linear with about a 5x increase, though I was not sure of the impact of the symbol failures.
3. You mentioned that a maximum of 28% of the symbols failed. What is the average failure in a run of 50 symbols? I am getting 7.5 failures on a run on average.
Thanks for a response.
Happy Holidays!
Size:
Color:
Mike, nice to hear from you. The points you raise have a major impact on trading methods overall.
First, a 10% drift as presented in my paper was only a $0.02 per day of upward movement on average for the total portfolio. This signal was drowned in the noise of random fluctuations (the error term). Taking away the drift part would leave you with totally unpredictable price variations where no tools could help you predict a future outcome. There would be no optimized 39 period moving average that could be applied to any of the data series. No technical indicator that would have any predictive value. You could make the assumption of the 10% drift based on the fact that it has been the average for the US market for at least the past 100 years. Thereby your tests would not be that far from reality over a 20 year period.
But as you already know, the market price distribution has “fat tails” as well as more price variations close to zero (the Paretian distribution). To simulate this, I used the sum of three Gaussian distribution with increasing standard deviation and decreasing probability; thereby introducing random price jumps of unpredictable random magnitude in the price variations. So you could have at random a 6 sigma move with a probability of say 1 / 1000 on a particular stock. Each stock in each test had its own random drift, with its own sum of 3 randomly generated distributions.
The data generated at the time was tested for randomness by Twiga (he was very good at those things). And if I remember correctly; his conclusions were that 25% of the data series could be considered not random. But as you also know, the sum of any random data series also produces a random data series. The “fat tails” or outliers have to be included in any back test you do; otherwise you are over optimizing and developing a trading strategy that will produce a lot less than expected.
In Fig. 7, what you see is the drift part (linear regression) of each of the stocks in that particular test with the average drift in red. Each test provided unique unpredictable data series which when averaged were close to the 10% drift. You’ll notice in Fig. 7 that some of the series go below zero and in the stock market that translate to you lose your bet.
Your 7.5 failure rate on average is still high. On a 50 stock selected at random there should be maybe 1 to 3 at most. But I suggest you keep your failure rate at the current level; it will force you to design more robust trading strategies.
What my research revealed me was that instead of trying to find which combination of indicators would turn a back test into a profitable strategy; that it might be better off designing trading procedures which followed preset profit equations (see the 11/29/2009 or 3/25/2009 posts). The emphasis is put on position sizing procedures.
Regards and Happy Holidays to you too.
Size:
Color:
Well, I now have the ability to generate price data using a method similar to your method. I did a quick and dirty trading system that starts with 5/50% allocation and adds another constant dollar allocation each time the stock price goes up by 1% and then sells everything when the price falls by a large amount. It managed to only obtain 3.5x the initial investment, which is probably about 5% CAGR, which is half of the 10% drift in the generated prices. This makes sense since I am under-invested a number of times. Needless to say I am re-reading your white paper again.
This should keep me busy for at least two more months. Once I get something close to your returns for one data set, then I can save the other data sets to files and start doing simulations across the 200 sets of 50 stocks to find robust parameters. Probably be around May before I have something workable. I will keep the group updated on progress.
I am surprised that no one else appears to have done anything with your research. I think it is one of the most original pieces I have seen in a long time. Thank you for sharing it.
Size:
Color:
Mike, thank you for the kind words.
Your approach is correct. You will need to do a lot of tests to convince yourself of the methodology just as I did in my own process of trying to understand the dynamics of the underlying equations. My strategy does not use fixed percentage of equity trades; they start at 2% or less and decrease in time from there. In time each trade becomes a smaller percentage of available equity. Each data series was different within each test and from test to test. The initial price was random – then normalize to 20 – all three Gaussian were randomly set in amplitude and drift for each stock. I could not replicate any data series. What ever the test run, all stocks simulated would be different from all previous runs. There was nothing from any of the tests that could be used in the next. And there lies the usefulness of the approach: what ever the stock series selected, you could profit from them as a group. You could save yourself some research time by reverse engineering my equations to see how they work.
The basis for the three papers is equation (16) in the first paper (Alpha Power) which led to a second representation in the equation on page 33 of the Modified Jensen paper. The latter presents the payoff matrix as a binomial equation and is of significance as it implies that one can extract from the markets what he/she wants based on a predefined long term trading procedure (again page 33). The procedure presented is not a unique solution; it is part of a family of such equations which result in position sizing methods whose sole purpose is to improve performance at the portfolio level.
I have a great admiration for the simplicity of the Schachermayer equations (see the Payoff Matrix). There is not much you can do to change what the prices will be in the future; the best you might be able to do is a better selection of long term up trending stocks. Notwithstanding, you can design a holding function matrix that can easily outperform the Buy & Hold strategy.
The method is base on averages, scaling in and out of trades and over-diversification. From an initial bet in selected stocks, trades are added as a behavioral reinforcement. It is within your decision surrogate that trades and their size are determined according to their incremental settings.
You are making one bet. It’s like taking the Warren Buffett’s 37 billion long term put option. What you ask from the markets is that in 20 some years, the market will be higher than it is today. And on this, I agree with Mr. Buffett’s bet: it is more than a reasonable bet that the secular trend should prevail.
In the end, you know, there is only one person that you really need to convince and that is yourself. You will be alone to make your trading decisions and it is the degree of your own convictions, your own beliefs, which will dictate your position sizing method. I had to go through the same process and the result of writing the research papers not only led to a better understanding of the game but also to the belief in my own trading abilities.
Regards
Size:
Color:
Well, still plugging away since the beginning of the year. With the base data set I am using that has a CAGR of 9.9%, I fixed some bugs in the initial implementation which just did buys and sells and went from 5% to 8% CAGR, obviously 1.9% below the market. I added a function to allocate more money on buys and take away some money from the losers which got me to 9.47%. I then did a crude asset allocation across all stocks to plow more money into my leaders, which got my CAGR to 11%, far below your 45% but at least showing some alpha at this point.
I now need to implement something that captures my profits on an individual stock basis and use that information to perform that asset re-allocation. Then look at more creative ways of doing gradient allocation, which will probably be the point that I go through your materials again. No break through yet but I am still plugging away.
Size:
Color:
It turns out that I was investing in the top losers and not the top winners. I am getting over 13% CAGR now, and my return curve has a nice power curve. Looking at your Figure 12 chart from the Alpha Power paper, it appears you ended with about $102M in assets and assuming a starting balance of $1,000,000 and 19.3 investment periods, that produces a CAGR of 27%. Above, you mentioned that a zero percent drift netted $72M, or a CAGR of 24%. Also, in that response above you talked about 10:1 reduction in portfolio return, which I am not seeing between figure 12 and the zero drift chart. However, looking at figure 14, which uses an incremental scaling factor, I start to see the 10:1 reduction and this is showing a 43% CAGR.
Questions for Roland:
1. Where is the 10:1 reduction occurring between figure 12 and the zero drift chart, or should the comparison be between figure 14 and the zero drift chart?
2. How does Cumulative Annual Growth Rate (CAGR) relate to alpha?
3. What did you see for an average CAGR across your 200 runs with a 10% drift? Is this figure 14?
4. What do you mean by incremental scaling factor?
I am just trying to define the objective that I am shooting for with your method so I can benchmark my progress. CAGR seems like a pretty standard way of measuring.
Size:
Color:
Roland: This is brilliant work.. should hold a lot of promise..
One thing that I am curious about is the effect on draw-downs with this strategy. Does the ratio of CAGR/Max Draw Down remain similar to Buy and Hold or does it change a lot after applying this strategy?
Size:
Color:
Hi Mike,
Interesting questions. You are trying to deal in absolute numbers when everything was relative and averages. Each test run was unique and could not be duplicated. Even with the same set of parameters, the answer would be different each time you ran a test. You should not be surprised if I said that when I set all parameter levels to have zero effect, the results were the same as the Buy & Hold. You wanted performance; then you increased the levels within specific constraints to generate some alpha.
The zero drift scenario was requested by a university professor on this site who knew quite well, as I do, that you can not profit from random data series and therefore this test should have blown me away just like a house of cards. But it wasn’t the case. The test itself was a long process. The first spreadsheet had some 400,000 cells filled mostly with elaborate conditional inter-related formulas and some 150,000 calls to the random function to set price variations. The latest spreadsheet has some 3,000,000 cells and over 600,000 calls to the random function, all to, in the end, execute Schachermayer’s equation: (H.*dS). 100 tests were ran and after each test I recorded the results; then averaged everything and posted the results as the zero drift chart.
The results of the zero drift scenario are outstanding. It showed that using position sizing procedures based on self-directed binomial equations one could not only outperform the Buy & Hold but do it on a grand scale. It also showed that position sizing procedures could help in the trading game where a zero drift scenario should have had an expected value of zero. You won even with an average 72% failure rate! Imagine what would have been the results with only a 3% failure rate.
So the point being made is that each and every test had totally different data series with no predictive powers that could be applied. You should look at the Alpha Power paper with a sense of “on average” as I selected figures mostly from one test as representative of hundreds being done, all of which responded to particular controlling parameter settings. Figure 14 was generated to show scalability and is a test in itself, different from the one used for the other charts as it had its own higher parameter settings.
What was done for Figure 14 was to increase some parameters within the constraint of self-financing (like pressing on the gas pedal). The main objective was to show scalability. I remember putting my own constraints (so as not to show the pedal to the metal since you could push performance even higher). I could not use the parameter settings for the Figure 14 test as the basis for the paper and then go from there to show scalability without the risk of being considered a crackpot. My goal was to remain reasonable while showing the principles at work, and elaborate the mathematical framework which would explain the results.
It is by controlling equation 16 that you determine equation 33 of the Modified Jensen paper. You want more performance; then you press on the gas, so to speak. This may require additional cash, a higher initial position in each stock, a higher and/or incremental trade basis, a higher leveraging factor, a higher level of equity buildup re-investment, a higher reinforcement feedback or a combination of these. All of which are under your control (see the stuff on the decision surrogate). You can also modulate these settings to your own liking. There are definitely many solutions similar to equation 16 that can be applied.
You play the game and you set your own trading rules (that in essence is equation 16). You may not be able to control the price, but you certainly can control what, when and how much you buy or sell. It is your decision process, your position sizing method that will generate your alpha. In your search for your own total solution, you will notice as you add accelerators, enhancers and scaling factors (all within your constraints naturally), that your CAGR will keep going up.
Regards
Size:
Color:
Hi Mike,
Roland's work & contribution is truly impressive. I have been following his work for some time now.
Are you able to test this within WealthLab or are you using Excel?
Thanks,
Mike
Size:
Color:
Trident
Thank you for your comment. Part of your question has already been answered in my 3/20/2009 post. Since in the beginning you start by buying less than the Buy & Hold; you suffer less in drawdowns at the portfolio level. You could even forego your initial positions and see a lot less drawdown. Any price decline is the same for all, what matters is the relative quantity on hand at the time of comparison. As the strategy evolves, your inventory in rising stocks will increase to the point of exceeding the Buy & Hold strategy, and some times, many times over. But this happens only in the case where you already show big paper profits. Your trailing stop should help you keep most of those. The price will be the same in both scenarios, percentage wise, but the dollar amount might be much higher on the rising stocks using the Alpha Power strategy. As for the downers, they are gradually eliminated and have less and less impact on drawdowns again at the portfolio level since they started with a low quantity which was further reduced over time.
The methodology is very chicken (risk adverse). It follows its predetermined equations, knows its capital requirements and knows beforehand the value that any price change will have on the payoff matrix. It’s like instead of trying to predict stock prices for the next twenty years you predict your behaviour to price changes what ever they may be.
Regards
Size:
Color:
Hi Red, I am programming this in Scala, which probably was not the best choice since it is still a little immature (especially weak file output capabilities). I should have stayed with C#. Scala natively supports threads which pulled me down that path, since I plan on spinning off many processes when I get this functional to try 200 combinations of 50 stocks for 1,000 bars randomly generated across my two i7 machines. The random generator is about 200 lines long but I need to add ability to save each series to a different file - it writes out one series (50 stocks x 1000 bars) to standard out. Everything is parameterized so I can have it generate any combination (400 runs x 2,000 bars x 100 stocks x 7% drift, for instance). That was the easy part.
Hi Roland, I have not dealt with changing my random data yet because I am still building out the functionality and am trying to baseline the performance of the functions as I add them. I am at 900 lines of code and counting (and Scala is supposed to require half the code or more than Java). The money flow between stocks still needs a lot of work as I am hopping in and out too much. I cut the trades in half this week by playing around with the money flow and that boosted performance to 16% but it is still pretty ugly. I am studying Schachermayer's equation now as well as diffusion algorithms (I have a degree in chemical engineer) to figure out how to progress at this point on the money flow. I am also adding some standard math libraries into the package (std deviation, variance, sma, etc.) so I can look at performance better.
I am hoping by end of February to get to 30% CAGR with this data set, and then I can add the threading, writing out to multiple files, do the simulations across 50 or more data sets, and then analyze the results with R. If it looks promising at that point, I can change the brute force searches to by more granular around promising values. Little by little I am getting there working some nights and weekends on this.
Size:
Color:
Hi Mike,
Do you think it could be programmed in WLD or is it beyond its capabilities?
I code most of my systems in WLD but also have some in C and more recently R. I have never used Scala.
If you would like to take this discussion off line please send me an email, mjreddington@gmail.com.
Good luck!
Mike
Size:
Color:
I am still early into the coding so keep that in mind with my feedback.
There is running 200 simulations of 50-100 symbols with each simulation having different data. That can be done with WL, though it will be painful.
There is dumping out the settings parameters and the range of performance values for each run. I think that can be done because one can add parameters to view on the individual stock performance tab. Need to save all of the intermediate values and not just the optimal performance values. It also should be able to be programmed in to WL and written to a file.
Buying and selling based on performance is easy to do with WL.
Selling appropriate stocks based on ranking system I believe can be done. One has to identify how much money is needed up front and then sell to raise that much money.
Selling portions of stocks to raise money based on a ranking system is probably much harder.
Varying the money allocation based on performance I am not sure if this can be done.
Having adaptable tuning parameters for stocks with different characteristics (strong performer, market performer, weak performer, or loser) probably can be programmed but would also need to be optimized outside of tool, which one needs to do anyways.
Right now I am cycling through each of the stocks within a bar four different times. I remember doing this with WL4 and that script ports over to WL5, so this can probably be done. There is the stop loss check, the buy limit check, the sell to raise more money, and the buy more of the strong performers which was why the money was needed.
Size:
Color:
On the subject of trading methods.
We often hear that over 80% of traders are on the losing side of the stock market game. Therefore, the first question is why so many traders fail. I believe it is in the way they play the game.
A few years back a professor (forgot his name, sorry) made up a test for his bright graduating students (most in management and economics). The game was simple and described as follows:
1. Each student was given 100 points.
2. They could place bets on the outcome of a 100 coin toss.
3. They won, it doubled their bet; they lost, well, they lost their bet.
4. The coin had a 60% chance of turning up head.
The students agreed to the rules and the winner (the one with the most points) would get the real money prize. The similarities with a stock market game were relatively close: an upward 10% drift with Gaussian volatility. The toss was the same for all and no player could do anything about it.
Where it gets interesting is in the results. 80% of the students lost their entire stake; even though the only viable strategy, which was obvious to all, was to bet head at every turn. This is like playing the stock market game with a 60% hit rate. And if you look at the math of the game, a 10% edge can be considered impressive, if not outright alpha generating. Then why did most students fail?
The answer is in the way the students played the game: for most, their trading strategy was mathematically biased to fail. Their betting method did not respect the game for what it was. The outcome of any toss was still a gamble even with 0.60 odds. Doubling up or doubling down (playing martingales) were sure ways to end up at the bottom of the heap. Playing using optimal-f or by the Kelly number where also almost sure ways to fail. The dip-buyer lost, the doubling down player lost, the optimal trader lost, the big bet at every turn lost. What got them was the variance of the game. They would go broke long before they had a chance to profit from the upward bias.
Those who won (the 20%) were those playing with smaller bets and the biggest winners where those improving on their bet size as profits increased. It was with their position sizing methodology that they won the game. They played within the constraints and stayed within the variance barriers. The overall winner was still a lucky student and no one could have predicted who it would have been from the beginning of the game. He played with a long term view; he knew his expected outcome, the variance of the game, and placed his bets accordingly.
Many of the principles learned from this simple game have been applied in my trading methodology. Small bets spread over many stocks so as to reduce the impact of any one bet while staying very well within the variance of the game. You generate alpha by your position sizing methodology which is reinforced by the reinvestment of part of the generated profits.
So the first thing to do is stop playing the game the way the 80% fails. Look at the “investment” game with a long term view. Spread your bets and reinvest part of your profits just like you would dividends. Study the game for what it is and let it teach you how to play. Then, play the game under your conditions, within your constraints, and by your own rules. You don’t play the game to be right; you play to game to win.
Good trading to all.
Size:
Color:
Roland,
You mention a 60% probability of heads and equate that to a 10% drift in stocks so the randomness of stocks is reduced with a 60% probability of rising over the long term? So if you buy a basket of stocks with a percentage of your assets, add to your winners with your gains and get stopped out of your losers.
How large of a gain do you need before reinvesting profits?
Do new positions have different stop-loss than older positions?
Assuming you get stopped out, what would be a trigger to re-enter a position in that stock?
Do you have profit targets or would you write calls against a position?
If your stock was "called" away, at what point would you look to re-establish a position.
Thanks,
Mike
Size:
Color:
Hi Mike (Reds),
You have some good questions but they do imply so much more, I’ll try to answer them as simply as possible within my methodology.
First, in the game, the 60% heads probability really translates to a 20% drift. This is an even better edge than the market. As you suspect, the volatility over the 100 tosses is reduced; but only slightly. Take away the drift and you still have a “Gaussian” random error term which will tend on average to zero. The standard deviation over the 100 tosses is 25 for a 50/50 game whereas it is 24 for the 60/40; not that much a reduction in volatility.
“So if you buy a basket of stocks with a percentage of your assets”
Not so fast. There is a selection process to be made. You intend to build a portfolio for the long term, and therefore, your “basket” of stocks should be composed of your best candidates for long term appreciation. Say you want to start with 50 stocks for your first cruising level; you assign initial weights to the 50 stocks in the order of your long term estimates. Not all stocks are created equal and therefore we should not treat them all the same. From your best selection - take your top ten - assign higher weights, bigger initial positions and higher trade basis which will result in higher capital requirement equations. Sum these up to find your total portfolio requirement.
“How large of a gain do you need before reinvesting profits?”
It depends on your degree of aggressiveness, the amount of leverage you want to apply, the level of conviction you assign to your picks and your feedback reinforcement function. Equation 16 is the controlling equation for this. Your mission is to end up with the highest number of shares in the highest performers within your selection without knowing before hand which stocks they may be.
“Assuming you get stopped out, what would be a trigger to re-enter a position in that stock?”
If you get stopped out, things are not looking good. Since at first you only had a small position, the real question should be: “should this stock stay in my preferred list”. If the answer is yes, then wait for a percentage rebound from the eventual bottom. Let the stock “prove” that it wants to go up before giving it your seal of approval. If the stop happens under $10, then start looking elsewhere. Stocks going under $10 tend to take years to get back over that mark. You are not in the dead money business and I am sure you can find better use for your capital. So on low priced stocks, my recommendation is accept the small loss and look elsewhere.
“Do you have profit targets or would you write calls against a position?”
You are in long for the long term. So your preferred holding period should be the same as Mr. Buffett: forever. By all means do write calls. It should be part of your total solution. And holding long term does not mean that you can not trade over existing positions.
“If your stock was "called" away, at what point would you look to re-establish a position.”
If called, your stock is doing well; then repurchase and sell a new higher strike call. Your objective has not changed; the stock is still in your preferred list and showing signs that it deserves to be there. They can call you as often as they want; it is all right with you; you reset your position each time with a higher strike. This should even increase your conviction in your estimate and long term goals.
Building a portfolio is a multiple period multiple decision process where it is necessary to determine which stocks to trade, the entry points, the bet size, the duration of positions and the management of inventory levels. You can use a decision surrogate to determine for each stock the best course of action in relation to all others in your portfolio. By having controlling functions you determine what you want to get out of the market and on your terms. You want to reward the market (by putting more money in it) when it rewards you first. And if you look closely at the capital requirement functions, you will notice that one of the requirements (or side effect) is that you are requesting the market to, in the end, pay for it all.
Regards
Roland
Size:
Color:
On the subject of optimization.
This has been discussed many times in my past 7 years on this board. It is a recurring theme. It is also the one subject which if not treated with respect can be the main cause of one’s future dismal performance.
I will try to give it a singular perspective.
First, there is nothing wrong with optimizing or over-optimizing for that matter. Optimization should be used to search for trading ideas and concepts; not hard numbers like top performance. By optimizing, we will always get better and better answers to what we think might be the real problem: finding our best solution to the stock market trading game. However, the whole process of multiple reiterations based on past data has its pitfalls.
In my opinion, any type of optimization must first and foremost satisfy: integrity. We “cheat” in your back tests, we are only deceiving ourselves. We peek in the future to obtain better results or we select from hindsight the best performing stocks for our trading method; again the only persons we can hurt are ourselves. It is when we try to sell our over-optimized script to others that our “integrity” should take a hit as now other people will also surely have to pay for our lack of “self honesty”. So my first advice is: always develop honest scripts, and, only then can you consider offering them to the public. Before getting blasted by some, please note that I have no scripts that have ever been offered to anyone.
It seems like that any type of optimization we are trying to do might translate into dismal future results when switching to live trading conditions and with real money on the line. For what ever we do more than once in trying to optimize a trading strategy: we are over-optimizing.
Here are some test conditions which invariably seems to lead to over-optimization and curve fitting:
1. Improving past performance using the same data set for every test.
2. Trying to find the best range of parameters for a specific group of stocks over the same investment period.
3. Picking from hindsight stocks to include/exclude in our back tests.
4. Using past statistical data for evaluating ranges or projections.
5. Using statistical data that can only be available from bar.count-1.
6. Using optimized past moving indicator values.
7. Using too short a testing interval.
8. Using too few or hand picked stocks to include in our tests.
9. Using only upswing investment periods (ex.: 80’s and 90’s).
10. Ignoring bankrupt, delisted or merged companies.
11. Trying to flip 50 000 shares or more on a stock every day.
12. Peeking in the future or using data only available from (bar.count-1).
13. Relying on past data as if it were really accurate (data glitches).
14. Trying to ignore outliers or bad investment periods.
15. Trading 5%-10% of our portfolio on every trade as in time these trades will come to represent tens of thousands of shares.
16. Flipping stocks where your trades represent more than 10% of the average trading volume for that day.
17. Putting all the money on the line on the latest multi-position dip-buyer script developed on market survivors only.
18. etc…
The list of things one can do when over-optimizing a script is a lot longer. All those presented, or any combination, can be detrimental to our portfolios or our follower’s portfolios. This is why integrity should be priority number one; first for ourselves, and ultimately, should we elect to spread our “trading wisdom”, for others.
It’s like what ever we do to improve performance, because of the iteration process itself, will result in over-optimization. We find where in the past our system did not perform well or that our selection behaved poorly and then hard code our strategy to skip over it or profit from it; result: better past performance but very bad idea. The over-optimization process will also give a sense of false confidence that can only result, as a conclusion, in losing more money.
Any weakness in concept, any superficial understanding of what is, or wrongly based market beliefs will produce dismal results when incorporated in our trading strategies. We set any type of unrealistic conditions in our strategies and these will rip us apart in future market conditions. The more we over-optimize, the more we are hammering nails in our portfolio’s coffin.
In this trading business, we rarely hear about the losers; they are just out of the game without even a whimper. But as a group, they represent about 80% of traders. It usually takes less than 18 months to transform a wannabe trader into a dropout with the main reason for quitting the game being a destroyed portfolio (no money, no game, ask any broker). Playing the market is a tough game. We want to be right, we will pay for it. We want the market to do what we want; we will pay for that too. We don’t quite understand the game; we will pay for every lesson we want to learn (as long as we still have cash available to play the game). We don’t believe in stop losses, the market will show us that maybe not only we should but that it is a must just to survive. We want to double down, no problem; the market really likes our money and will invite us to double again and again. Can you say in a single phrase: out of the game, next!
The market has no memory (certainly not of us), it has no mercy and will not discriminate (it will take anybody’s money). The market owes us absolutely nothing. However, it will take all we want to give it; all our time, all our talent, all our savings and more if we let it. It is truly up to us to decide before putting our money on the table what our optimum betting system will be. In my opinion, we can extract from the market what we want or let it take all we have; it is our choice.
The market has changed a lot in recent years. A trader needs a fast computer, adequate trading software and a very good understanding of the game just to stay alive. His competition now comes mostly from machines with sophisticated trading software ready to respond in a microsecond to the changing market environment. The use of high speed computers connected directly to the floor of the exchange using fast data feeds that enable them to front run most of the market itself. The competition is fierce, and the reward is huge for the big player that is ready to play and even to front run his own clients like in the Merrill Lynch case recently. The other side of your trade will try anything to push you to trade at the wrong time or at the wrong price. The simple fact of leaving your stop loss as an open order at your broker can be devastating as in the May 6th flash crash where all stops on the books were executed down to a 60% decline. Tens of thousands of traders had a very hard lesson to learn that day. And where was the SEC, well not on their side for sure.
We optimize because we believe that the game is fair. It’s natural, because on our side of the game we can only play fair: we trade on the prices we see. It is not the same for the other side; 60% of the time we are dealing with a machine. Thinking that having Level II is the cure and levels the playing field; well look again. Some 20% of orders on the books are of the iceberg type, over 80% of orders are cancelled not to mention the 10 thousand orders that are flashed and removed within seconds after being posted just to occupy a quote server while trading on regional exchanges.
We need to develop scripts that will withstand the future, not the past. Nothing that was should be expected to repeat in the future. It is our responsibility to first protect our capital from what ever will happen in the future and then find ways to improve our performance beyond the Buy & Hold trading strategy. Like I have said before, it is not an easy game. But I do think that we can give ourselves a chance to succeed. And it all starts from simple beliefs: 1) believe in yourself, 2) don’t believe all the scripts you see or test, 3) make your own or modify somebody else’s script to do what you want it to do, 4) make sure that what you do has a real foundation in reality, 5) always keep in mind that the money you make trading the markets is yours, you’ve earned it the hard way.
When we cheat in our back test does not change the future. However, do not expect the future to evolve following those cheats. It is up to us to realistically extract from the game what we honestly have seen from our backtests what we could realistically extract.
My solution to the over-optimization problem was to design randomly generated data sets which would have quasi-random behaviors that closely mimicked real market data including fat tails. By having each test as a unique data set with absolutely no predictable price movement; I was assured of not falling in the over-optimization criterions listed above: no survivorship bias, no hindsight selections, no favorable selected investment periods, and no forecasting feature on any one criterion. If my script could survive under those conditions; then I thought that it would be well prepared to tackle the future.
Good trading to all.
Size:
Color:
It has been about 6 weeks since I gave an update. I hit a road block in terms of new ideas to improve the performance and went back to the author's site and reread his papers. Probably the most interesting one for me at this time was his
http://www.pimck.com/gfleury/payoffmatrix.htmlEnhanced Payoff Matrix paper. I ended up identifying some functions that I thought would be valuable, specified the arguments that they would need, and then rewrote about 30% (300 lines) of my software. I am now at about 23% CAGR, which is 140% above the 9.8% CAGR of my data set, and over 20% across 4 different data sets using similar settings. I think I will be adding leverage into the software at this point to get it closer to Roland's model. He has numbers with 50% leverage that show 45% CAGR and I could be at 35% (23% x 1.5) with the extra cash infusion, assuming I allocated in a straight forward manner, which he does not do.
More importantly, I had set out to verify the author's results by the end of February and I definitely feel that his method works. After the leverage and some more reviewing of the results, then I will be at the point to reproduce the results with other data sets. That should keep me busy for another two months.
Size:
Color:
This is for Mike Caron
Hi Mike,
Since you did re-read the Payoff Matrix; may I offer the following observations that might help you in your quest and maybe save you some time.
The payoff matrix is the most condensed form I have seen to represent any trading strategy. In this respect, Schachermayer did a great job. This is why I converted to his mathematical vision of trading systems. Needless to say all my mathematical formulas now have to fit within his simplified model.
As you must have noted, in just one variable H as in sum(H.*dS), he has resumed most of equation 16 (see my first paper) which is re-cited just above his simplified model in the Payoff Matrix.
Equation 16, the section equivalent to variable (H), which describes the holding function, does enumerate variables used to control the evolving inventory of each stock in relation to all others in the portfolio.
You will find in equation 16 trade enhancers, positive reinforcement and feedback controls that kick in only for the best performers of the portfolio.
It is in the design of these boosters that you should now direct your attention. It is in the enhancers and reinforcement procedures for the best performers that you will be able to add more leverage and therefore more alpha points.
Keep in mind that, following the alpha power philosophy, the best performers are to be rewarded with an increase in their inventory while non-performers punished or removed for not performing. The more a stock price goes up, the more you are ready to buy relative to all other stocks in your portfolio. A stock stops performing; well it goes on hold for awhile or you are out of there (you take your profit and run). Nonetheless, give some leeway for wiggles, prices do fluctuate you know. Your stop loss should provide sufficient wiggle room not to be triggered on every minor pullback. To resume, stock performing above average are put on steroids while those performing below are squeezed out of the game. No wonder your CAGR will go up: you make big bets on top performers and small bets on losers.
In what I see from your research, you are getting there. At every step, at every improvement you make, you add more alpha points. And as I have mentioned in previous posts, I do expect you will find a solution within the whole family of solutions that will be yours; and I suspect quite different from mine. That is great since it was my main objective from the start. The solution you will find will be unique and follow your own vision of what you see as a more than viable trading system. It will have the advantage that you will understand all its idiosyncrasies and will know at all times how to tweak your equations and procedures to improve performance. You will even find methods that can push your overall performance to new heights; in which case, I would really appreciate some private feedback; I’m always looking for improvements too.
I only wish you the best.
Regards
P.S.: May I also suggest that you add a covered call program to your leveraged scenario.
Size:
Color:
Lately I have been spending some time on the old WL4 site. With over 1800 scripts frozen in time since August 2008; it represents a treasure trove for interesting analysis.
This is the best walk forward test one can do as none of the scripts has seen its future data. Future data represent about 45% of the price series; at the same time, 45% of the oldest data has been removed. And since the ranking is still being done one can look at how old stars have done. It is a unique research opportunity.
In general, what I did observe was that most of the scripts suffered return degradation as if they broke down after August 2008. Positive returns are hard to come by and when positive the returns are relatively low. The most striking exceptions being peeking scripts, again they prove that they can do well what ever.
With over 1800 scripts one has to consider that a lot of tricks to produce worthwhile profits have been tried by all these generous authors. From the simple to the complicated, from impulse filters to Fourier transforms, from walk forward to multi-systems and using all types of indicators or mix thereof; you make your pick. Everything seems to have been tried; but it still should be considered only as a starting point.
Good trading to all.
Size:
Color:
Over the past few days on the old WL4 site, I have tried the stocks that other members were passing through their own scripts over an existing one that I modified with a few of my own trading procedures. I used as basis the Trend Check V2 script by Gyro which was published on the old site in 2003 (a way to somewhat hide my own procedures). This way, the script would be dealing with data it has never seen but with a different trading methodology. By the way, Gyro, thanks really nice work.
With some of my own trading procedures added to the Gyro script and the list of stocks that other members were testing, I have compiled the following simulation results.

What you have is a basic WL4 simulation over the past 1500 bars (about 5.8 years’ data). When designing trading procedures on the old site’s simulation environment you have to accept some limitations. For one, I could only see the last 11 months of data. Second, I could not see how my functions behaved over the prior 5 years. It is like implementing trading procedures blind. It therefore forces you to design procedures based on your statistical understanding of price movements.
A typical screenshot looked like this:

And another:

From the data, one can really do, do I say: “great stuff “, using WL4. So, Cone and other members of the team keep it up.
For those who ever wondered what was behind the Alpha Power methodology, the above shows part of what is implied in reinvesting part of the equity buildup is rising stocks.
For those that have tried to duplicate my results using their own scripts, well I wish you luck!
Good trading to all.
Size:
Color:
I hope that my prior post makes the point that adopting an accumulative stance in the market can have its benefits. But in case you still have some doubts, I did the same thing today with what the members were analyzing and more. So the following excel extract does summarize my test activity.

What I would like to bring to your attention are the trading statistics. The average profit compared to the average loss is definitely to the trader’s advantage. The script seems to have more than a tendency to let the profits run while limiting the losses. And the average loss per trade is more than tolerable in a trading scenario. We all have seen a lot worst!
Also, some might consider this as a fluke, an aberration of sorts. There are over 80 stocks analyzed in these two reports. I agree that the method of choosing the participating stocks was on the lazy side: just picking what others were looking at. But I think the method is as good as any other. At a minimum, it certainly had the disadvantage to deal with whatever was presented.
So, my suggestion remains the same: a trading script is not only an in and out trading process. A vision of what is required long term is also a requirement. It is not by betting short term on every whim of the market that you can win long term; it is by taking tolerable short term bets that you hope will hold long term.
Good trading to all.
Size:
Color:
The task of improving performance is most often daunting; you think that by improving on such or such parameter that the output will show in improved overall portfolio performance. But like most, you soon realize that the improvement is not across the board.
I used the same list of stocks as the last post on an improved script where I wanted to increase across board the number of trades in the right direction, meaning more profitable trades with a higher win ratio and higher profits. The table below shows the results. It is relatively easy to compare with the one in the previous post.

The number of trades increased by 981 while the number of losing trades increased only by 67; an impressive upward push. Alpha points are very hard to come by at this level. Buffett has achieved an outstanding 22% over his career and has predicted that he will not be able to sustain that level in coming years. The improvements added 6.25 alpha points to an already high compounded return while the Buy & Hold managed to add 0.10 on this up day.
The across board performance improvement (read at the portfolio level) is that more remarkable that up to 3 out of 4 trades were triggered by the random function (rand()). The average loss per trade remained about the same while the average profit per trade decrease a little on a higher number of trades. The added trading procedures produced more than 12.3 millions in additional profits while increasing losses by some 14 000 dollars (13 774 to be exact).
My first question was: why the improvement? NO, not really, I knew before the test why everything would improve. I opted to accumulate shares at a slightly higher rate which would increase the number of trades which would increase the potential for higher profits. I technically increased my holding function.
It is all within the mathematical framework presented in my Alpha Power paper trading methodology. The Jensen Modified Sharpe paper says the same thing but with a higher level of mathematical equations. The underlying philosophy is that we can not change the price except maybe the very second we make a trade; the price is the same for all, past or present. As for future price, well I have no control over that. But the equations in the papers state that by managing the inventory with an accumulative stance you can improve performance: you can gain alpha points. You try to increase and hold your positions longer for higher profits and you do this gradually in time. It is a relatively simple concept.
The above table shows that by increasing your holding function you can achieve higher returns and not necessarily with that much added risk. And this can be done across the board on your stock selection. In this case, the stock selection might have been unorthodox or on the lazy side (pick what others are looking at). But all the stocks in the list saw improved performance metrics by adding more trades even if they were triggered by a random function.
Hope that this exercise will have value to some… The last few posts do demonstrate with an example how the Alpha Power methodology can be implemented and that it can be controlled by your view of the market and your trading strategy.
Good trading to all.
Size:
Color:
As follow-on to my last post, where I tried to show that improving on trading procedures with a bent on accumulating shares over time had for direct effect an improvement in alpha points; I was left with one more test.
If the new script improved performance, then it should also improve performance of the first batch presented a few post back. There was only one way to show that in fact it was the case, and that was to redo the test on the same stocks with the improved script.
The table below shows the results. In all cases we see performance metric improvements as expected. And thereby provides another piece of evidence as to the value of the modification applied to the overall trading strategy.

The increase in performance can be seen across the board. All the stocks showed better metrics compared to the first iteration. In all, 86 stocks tested, 86 improved.
This particular trading strategy adheres to all I have written in my papers and on this board. It is a show of the Alpha Power trading methodology at work. It also demonstrates that the Buy & Hold is not dead; it only needs a little dose of steroids.
Good trading to all.
Size:
Color:
Hi Roland, Thanks for trying your strategy on real stock prices and showing the potential. The difference between buy and hold and your strategy is astounding! Also, what type of leverage are you assuming? Is it still 50% leverage.
I am struggling to make progress because of some really ugly code that has evolved quite a bit since I first started coding around the beginning of the year. I finally started to componentize the code into classes this past weekend as well as implement some unit testing. I modified my stock cumulative objective this weekend to accelerate going to full ownership of a stock after a 20% increase in price rather than waiting for a 100% increase in stock price. That change resulted in aggregate total balance increasing from $2M to $6M after 220 weeks. This was tested with my March version of the code after plugging in the modified stock accumulation library. The code then encountered divide by zero errors somewhere preventing further updates to the account balance. I need to go find that problem now. Anyways, I am still plugging but my free time is dwindling quickly as the good weather approaches.
Size:
Color:
Hi Mike,
Nice to hear from you. My previous posts were intended to make an impression and show finally what can be done using the Alpha Power methodology. I’m convinced that at one point you will get there, and it will be “your” solution adapted to your view of the game. So… keep it up.
I started the Alpha Power project some 3 years ago. Always sidetracked by ah, you also need this or that. I had to prove to myself that the method was worthwhile by setting the mathematical framework where it would have to survive. All the academic papers I read at the time were saying the same thing: If there is some alpha, long term it will tend to zero and the optimum portfolio over time will tend to the market average. End of discussion. They are still saying the same thing today.
But I already had this model in Excel using randomly generated price series that showed you could generate alpha and at a high level. I wanted to know why and from what principles you could extract some alpha so easily when 75% of the investment industry could not even match the averages.
So my first task was to prove mathematically you could generate alpha that you could keep long term and that was not generated by luck alone. I must have read some 400 academic papers to see all the points of view. But none was showing a glimpse of lasting alpha. Yet, Buffett has generated 12 alphas points for decades. From my first two papers, you have all the formulas required to build an alpha generating system. It is not by the price functions that you will win; the price is the same for all. It is by working on your holding function that you can beat the Buy & Hold by simply improving the method a little.
After my last paper, about 2 months ago, I started the process of implementation: finding ways to program this thing according to the methodology. So I can understand the efforts you are putting into this.
In all the above tests, no leverage was used. You can imagine what will happen when leverage will be applied. Also, the option program has not been enabled either. Both in tandem would push performance even higher. But again, I’m being sidetracked by other performance enhancers.
Add that from my papers, all this can be put on automatic and is totally scalable up or down! You can imagine that we both still have some work to do. I think it is worth it. Look again at the formulas, your solution is there and it is not unique. I’m sure you will find your own interpretation.
Regards
Size:
Color:
Judging by the number of views, it's an inspirational topic. Thanks for posting!
Size:
Color:
Roland:
First let me applaud you for your work and willingness to share with the community. I have followed your work and papers since the beginning and it is refreshing to see more Wealth-Lab topics concerning investing / trading (like Ted Climo’s article) rather than programming.
That said, where to begin with the questions. Let’s start with the basics.
If, for example, I take 1500 bars of Yahoo daily data (from 4/26/11) for Apple (AAPL) and apply a Buy and Hold strategy with a starting capital of $100,000.00 and a commission estimate of $10.00 per trade, I get a $865,574.13 profit with a CAGR = 45.08% for the 5.8 years.
You show a profit of $43,214.
As a broader example, if I take the first 43 symbols of the NASDAQ 100 and apply the same starting capital ($4,300.000 / 43 = $100,000 per symbol) and trading costs to each, I get a total profit of $8,548,848.28 with a CAGR = 12.58% for the same time period.
I have no doubt your papers and equations represent an improvement to Buy and Hold, but I would like to first understand the framework used for comparison.
Thanks again for sharing with the community.
Dave
Size:
Color:
Hi Dave,
I see your point.
However, all the simulations were done on the old WL4 site where all you can supply is your script and the stocks you want to simulate on. All the price data and testing conditions are on the WL4 site.
The test results in the tables are a copy and paste to excel; what ever the result was. My script starts with no position and waits for its first 5k bet for as long as it takes. I’m not clear as to how the simulator handles this type of condition; I just took the Buy & Hold numbers for granted. My focus in these simulations was not Buy & Hold.
I did run the original Trend Checker script by Gyro (and a few others in the top rated listings) on the same list of stocks and got numbers that were close to the Buy & Hold reported and therefore, to me, the last column seemed in line.
I design holding procedures with a bent for the long term. I only see about 200 bars of the 1500 bars of data. I know the general behaviour of my functions but I can’t exactly know how they behave in the first 1300 bars. I only know that my holding functions should performance according to my script. I’ve kept a copy of all test charts generated and all have a system profit pane as shown in a previous post to corroborate my numbers of interest: the other columns.
Regards
Size:
Color:
Some notes on my test conditions.
I used 2 stocks lists of 43 stocks each with 1 duplicate used as reference. The choice of 43 stocks does have profound significance: it’s the number that could fit on my monitor without using PageUp / PageDown all the time.
But seriously it was also a number to show sufficient diversification. The stock selection was simply what other members were viewing on the old site. So the selection has survivorship bias, an element of randomness and an upside outlook since in general WL scripts tend to go mostly long.
When you make improvements to your script; it is usually done on a single stock. Then to know if the improvements have real value, you have your script go through your watch list. The improvements often tend to be some form of curve fitting or optimized settings on your test stock. Usually, the improvements break down; not every stock it the list benefit from the modifications. As a consequence, it’s back to the drawing board to start the whole process again until you find worthwhile trading procedures. The more improvements you bring, the more the performance of your watch list improves as should be expected. It’s like finding that 37.56432 is the perfect moving average period to obtain the maximum portfolio performance on your watch list. This makes your trading strategy very fragile: its good on past data, but you certainly don’t know how your script will behave in the future.
The real test should be on another list of stocks that have not seen your improved procedures; and you want to see in this second test the improvements resulting in higher performance. That is why I think I had to come back with the results of the second test, kind of close the loop.
The real test is then to feed a third watch list to the script and see how it behaves. Was the edge maintained? Did the procedures maintain sustainability, marketability and remained realistic over the test interval.
With the same selection criteria as the first two tests, here is the third. It is not the best of selections but it is a selection.

I am not sure if I would have picked the above stocks some 6 years, but then again, I did not have this script at the time.
I am still going over some of the scripts on the old site looking for code snippets of interest. Sometimes, I find something and feed it my stock selection. If the performance is worthwhile (which is not often), I try to understand the philosophy behind the trading procedures and try to extract the edge for use in my own scripts. But I think that is what everyone is doing.
May I be so bold as to recommend that you past your own script against the same stock lists and report back, we could then exchange on the philosophy behind our respective methodology. Mine, I think, I have made clear with my papers. And from my last paper, just as Buffett, I have made a bet on America. I am playing on the long side for the long term.
Size:
Color:
I am still trying to extract worthwhile scripts from the old WL4 site; add a few modifications - following my kind of trading recipes - and see what happens.
The following was accomplished today in an attempt to improve upon the Neo Master V2 strategy:

If you read carefully, I think you will find the numbers are really outstanding. The Alpha Power methodology has hidden powers that need to be used…
Good trading to all.
Size:
Color:
Roland:
If you have the time, would you mind running your modified script on AA or BAC from the Dow ?
Curious to see the results on currently underwater symbols using your methodology.
Thanks,
Dave
Size:
Color:
Hi Dave,
You raised a seemingly simple, but relevant, question. Here, it generated quite a debate. What should be included in the selection process? We back test on watch lists of stocks for witch we know the past. From your question, without testing, just by seeing the charts, I can say that AA would be nicely positive while BAC would still be underwater being some 80% below its 6 year high. But then, I realized that in the three tables presented, there were no banks. And this generated another question: why not?
I know now that there was a financial crisis, but in 2005-06 what would have excluded the banks from my watch list. And what about the 200 or so banks that failed during the last two years. The stop loss would have taken care of those but for the near misses like BAC or C and others would I have stayed the course? In hindsight, they would have hit the stop loss long before their respective lows. But that does not mean that six years ago, they would not have been on the list.
As I’ve stated before, the stock selection was simply what other members were viewing on the old site. So the selection does have survivorship bias, as well as an element of randomness. However, this does not mean that I should throw everything or anything at the script. That was another area of inquiry that your question raised.
I’m in the implementation phase of the Alpha Power methodology. The method aims at accumulating shares over time while at the same time trade over market cycles in an attempt to generate funds to accumulate more shares in the future. This implies that the script is looking for stocks going up long term. I did not even try the script on FAZ, SKF or QID in an attempt to accumulate shares. They represent a contradiction with the purpose of the script to such an extent that long term they would destroy the portfolio, as in a rising market, their future is zero; and accumulating shares down to zero does not make much sense.
The script you design must adhere to a philosophy, and will have some constraints. I don’t design universal scripts; a one size fits all. I therefore put emphasis on the stock selection process; it should be the best you can according to the orientation of your scripts. It’s the same for someone wishing to develop a shorting script; I would suggest looking for stocks that are going down, not up and that have a relatively short future.
I presented the above tables in hope of generating discussions on trading philosophies. One thing for sure, you should try your very best script on the stocks presented and compare the results. I’m just making the point that by following the Alpha Power methodology of trading over an accumulation process, maybe one can get better results than by trading alone; even if at first it is over a selected group of stocks. Looking at the numbers, I remember that stock after stock I was impressed with some more impressed than others.
Thanks for your input.
Regards
Size:
Color:
For those that have followed this thread and would like a copy of the tables presented in prior posts in an Excel format; follow this
link to my latest update. At the same time, you might be interested in reading the implementation phase of my ongoing search for some alpha.
Good trading to all.
Size:
Color:
My mission for the past two days was to set one of the controls described in my Jensen Modified Sharpe paper: setting the desired profit level. From the paper, it is said that you can preset the sum of profits generated. It is not said that you will reach them; the governing equation is dependant on the size and nature of the price fluctuations and that can not be guarantied.
However, controls can be implemented in the “should prices move in such and such a way sense”, then the holding function can be scaled to reach profit levels. This is a remarkable attribute of the Alpha Power methodology. You want more profits; you preset more pressure on the holding function controls.
The chart below presents simulations done on the old WL4 site today. What can be seen is that as the level control increases, profits increase as well as the quantity of trades. The level control regulates the holding function.

The price series over the trading interval is the same for all. It is the trading strategy, the manipulation of the holding function that will make a difference. In all these tests, the bet size was 5k for each trade and by allowing gradually more trades at each level produced higher overall profits.
What ever the script I design, I most often use RIMM as testing candidate. Some 6 years ago, it could easily have been chosen to be part of a portfolio: it was only going up. However, over the last 6 years, RIMM has gone from a high of $ 140 down to $ 45. For someone wishing to trade on stocks that go up long term, RIMM is certainly not the best candidate for the job. Nevertheless, the methodology survived and produced scaled profits based on the pressure applied to the holding function.
Personally, I find the concept interesting.
Good trading to all.
Size:
Color:
Why Does It Work?
I am always looking for reasonable explanations for my scripts; what makes them work, what are the principles at play and what is the main reason for their high or low performance. Are the improvements really real and operate at the portfolio level or are they just curve fitting on a single stock? These are all legitimate questions and if I can’t provide a reasonable answer, a common sense answer, then it should be back to the drawing board. I need to know where are the strengths and if I can get more of them. I also need to know where are the weaknesses and if I can get less of those. Naturally, all I do must fit within my global vision of the game or/and until such time as I find something better.
A simplified version of equation 16 from my first paper Alpha Power is presented below:


It says that the Alpha wealth generation function is a simple Buy & Hold strategy with the added twist that the inventory on hand (Q) is put on an exponential growth function (g) to which can be added a short term trading algorithm (T), a covered call program (C) and an exponential bet sizing function (B). A leverage factor (L) can also be added to push performance higher. All contribute to added portfolio performance. Removing all the control variables would reduce the Alpha wealth equation to a simple Buy & Hold:

Buy & Hold equation
Based on recent test results (see prior posts), I tried to explain the achieved performance in light of the Alpha wealth formulation. What ever the performance achieved you need a reasonable explanation for the results. It is easy to find explanations when your script loses but when your performance exceeds the seemingly reasonable, what then?
Alpha Wealth Generation Formula
This is my attempt at providing an answer in light of my trading philosophy and its mathematical framework. The table below starts with the same initial capital as in the three tested data sets. My methods are scalable up or down; so view the initial capital just as a comparison point.
The objective is to set the value of some of the variables in such a way that the performance result can be reached and that they can provide a reasonable explanation for these same results.

First, since no leverage was used and no covered call program was in force, both these controlling variables are set to zero (no influence on the outcome in the aforementioned tests).
The inventory growth rate variable (g) was set to 1 meaning full utilization of the excess equity buildup. The bet sizing variable has for mission to increase bet size as portfolio value grows. It was set to a reasonable value; after all the primary objective of the method is to accumulate shares long term when feasible. This accumulation only occurs if there is a sufficient equity reserve to add to the existing inventory buildup.
Equity Infusion Trading Method
There is only one variable left: the trading equity infusion method. For the numbers to approach test values it was required to set that the short term trading method was providing the equivalent of 110% increase to the inventory accumulation formula. The short term trading method alone was generating enough cash to acquire more shares; practically feeding the inventory accumulation process to a large extent.
A Reasonable View of the Numbers
These are the most reasonable numbers and explanation I have that can explain the results for the three separate tests provided (over 120 stocks in all). Note that I have set the rate of return at 20% even if the long term market average is closer to 10% than anything else; therefore the Buy & Hold column may be divided by two. Why I used 20% return was simply that the selected stocks in these tests were all survivors and I thought that it would more than reflect this inherent upside bias. Setting a lower value for the rate of return would force to increase the bet sizing algorithm or/and the trading component contribution rate to overall performance (see table below).

To obtain about the same result as the first table, it was required to increase the Bet Sizing rate to 0.55 and the Trading component to 2.5. This means that the trading algorithm would have to have been much more efficient at extracting profits from market swings than first presented.
Increasing the trading algorithm, the bet sizing function, implementing a covered call program or adding leverage would all have for effect to increase performance. Another way to increase performance would be to have a better stock selection process than average.
It was shown in the previous post that increasing the number of profitable trades over the trading interval leads to increased overall performance. The reasoning is understandable in light of the preceding explanations for the overperformance.
The Alpha Power trading methodology presets mathematically the trader’s desired behavior to future market fluctuations. As a method, it allocates more funds to the higher performers while at the same time reducing and starving non-performers. The method ends up making big bets on big winners and small bets on losers. It is really a Darwinian approach to playing the game.
Good trading to all.
Size:
Color:
Over the weekend, I wanted to convert an ordinary script to a super performing one. Now, that is all relative. To me, the only measure is the ultimate outcome of a particular trading procedure. And then again, what is super performance? Should double the Buy & Hold strategy be considered as super performance, or are there ways to go even higher? Again, to me, the reply is simple: how much you got and how far do you want to go?
So over the weekend, I converted the QQQ and QID Trader script found on the old Wealth-Lab 4 site to my trading philosophy. Naturally, if I convert such a trading strategy to my own taste, it better outperform or else.
After quite a few modifications, I finally accepted my modified version of the script. All the tests were first done on a single stock; there was no way of knowing the overall behavior for a group of stocks except in general terms. I needed a comparison basis, so I selected a group of stocks that had already been tested. If my improvements were worthwhile then they should be translated in improved overall performance metrics.
The ultimate outcome exceeded my previous tests by more than a reasonable margin. The results are presented here:

Achieving such an outstanding performance is way beyond the Buy & Hold strategy. At least I hope that someone agrees.
May I suggest that you start comparing your own very best trading strategy against the above results; and see if you can stand the pressure.
My primary objective is very simple: what ever strategy I devise, it better outperform the Buy & Hold strategy otherwise why fight? Investing time and resources would just go to waste.
Good trading to all.
Size:
Color:
The Livermore Challenge
Here is the challenge: we start with the Livermore Master Key script found on the old WL4 site. You can modify it any which way you want, even change its trading philosophy, its trading procedures or its rule definitions. The object is to raise its performance, not only above the Buy & Hold, but way above it. I intend to report back with my own results as I progress in improving its performance level.

To assist you,
here is the Excel file you can use to report your results. It is filled with today’s results using the script, as is, on the list of stocks in the table above.
Of note, the Livermore Master Key script is not that productive; it barely maintained its initial capital. In fact, it has horrible metrics: 24% hit rate with only 6 stocks out of 43 exceeding the Buy & Hold.
I think that the most useful concept in this script is that it has a trend definition. It might look as trivial to some, but to me, designing holding functions with share accumulation programs, a trend definition has some importance. I anticipate that the outcome of this challenge is that the trend definition of this script is worthless and as a corollary the whole Livermore methodology has very little value. However, with all the changes that will be applied to this script, I think that in the end its name will need to be changed to reflect its much modified nature. I will be starting my own modifications right after this post.
So welcome to the challenge.
Size:
Color:
Well, I thought it would take at least a few days first to understand the Livermore Master Key script and then attempt modifications to improve the design. Livermore and his trading methods are often highly viewed. However, based on the performance results presented in the prior post, one should have reasonable doubts as to the efficacy of Livermore’s trading methods.
It took less than an hour to modify this script to outperform the Buy & Hold. And a mere 20 minutes more to greatly exceed it performance wise. I find the output of the test to be very erratic, but then, my first modifications to this script were not intended to be cute or with finest. I usually bulldoze over an existing script, looking for its strengths which I hope to improve upon and at the same time reduce its negative behavior. It’s like some design their scripts with the intent to profit as much as possible while at the same time trying very hard to shoot themselves in the foot.
So here is my first draft (Model 0.03 Level 0) of the modified Livermore script:

I think that this raises the bar so high that I don’t think anyone on this board can exceed these results. Personally, I will continue to improve this script as its trend definition may have some merit after all.
As a direct consequence to the above table, I think this will probably end the challenge.
Good trading to all.
Size:
Color:
This is a follow-up to my last post where I said I would continue to improve performance wise the Livermore Master Key script even if the challenge ended too early.
The Alpha Power methodology plays mathematical functions; not necessarily market indicators. The formulas are in my papers. You preset your trading behavior based on these mathematical functions and then wait for the market to hit all the triggers generating the trades. If the market does not move in a way to trigger the buy, sell or stop loss orders, you simply wait for it to come to your terms of engagement.
The method has for primary objective to accumulate shares for the long term. It will buy shares while in an uptrend ready to hold indefinitely if needed or until one of the other two possible events occur: a short term profit is generated in which case the shares are sold or a stop loss is hit. The very nature of the stop loss changes, for one, it is allowed to fluctuate more. Yet, when taken, based on the table below, it is relatively small.
The method is a trend following system; it buys on the way up while accumulating shares for the long run. It does need some form of trend definition. It appears, after some modifications, that the Livermore Master Key script may have, in this sense, a usable trend definition after all.
Here is my latest iteration: Model 0.05 Level 1. It’s an improved script with a boost in the preset accumulative functions (Level 1). The outcome should improve performance metrics across board, not only a few stocks here and there. It was tested on one stock (in case of bugs) and then applied to the whole list. The results follow:

Of note in the above table are:
1. The sum of all losses for the entire stock list over the 5.83 years test interval is less than 1% of total profits.
2. The improvements, what ever they were, did indeed improve performance results for all the stocks in the list.
3. The win ratio is over 80% where the average profit is over $19,000 while the average loss is less than $ 400.
4. Over 60% of stocks lost less than $100 on average when executing their stop losses.
5. Achieving over 100% annual compounded return over a 5.83 years investment period is certainly more than remarkable.
The main reason for this methodology to work is that it tries to do everything at once. It will buy stocks for the long term, will trade over its accumulative procedures, and will reinvest excess equity (paper profits) in more shares. It has preset control functions, objective functions that can be regulated.
In the above test no leverage or covered call program was used which would have, if applied, pushed performance even higher.
Good trading to all.
Size:
Color:
The worst type of tests for any trading strategy is to be confronted with a different data set. What was used to “train” the script to perform on a particular group of stocks may not work as well on another group. Usually, this is where a script breaks down, its performance being greatly reduced due to the curve fitting and over-optimization done on the first tested group of stocks.
In this perspective, using the second data set presented in a prior post, I ran the same modified Livermore Master Key script as in the previous test (Model 0.05 Level 1).
The outcome:

As can easily be seen, the performance level has been maintained with the same general characteristics as in the previous test. You even end up with a higher return.
The outcome of this test is no surprise. The Alpha Power methodology deals with preset mathematical equations, not trained market indicators. It plays on averages, scaling in and out of positions with a bent on accumulating shares on the way up ready to hold for the long term. The method knows that it can not win all trades and is ready to accept a stop loss with ease which on average ends up to have little consequence to the overall performance as can be seen in the table above.
It took me quite some time to develop this methodology, even more to verify to my satisfaction that it worked. A lot of time has been put in building the mathematical foundation that could explain the trading methodology. And now even more time is being spent in the implementation phase. I see a progression in all these test results and it points to even higher returns being possible.
Good trading to all.
Size:
Color:
So, when are you opening a fund on Collective2.com? I have so little free time both last month and for the next month that I have not made any progress.
Size:
Color:
Hi Mike,
Sorry to hear that you did not have the time to delve more into your unique trading procedures. However, as you can see, you can extract from the market much more than the usual 10 to 20% compounded return. I hope you find the time to unleash your own power trading methods. For me, you already know how hard it is to gain an edge in this volatile market. As for playing Collective2, it would not only be playing for peanuts but in my opinion a total waste of time. Sorry to say this but this is much bigger than hoping for a few hundred bucks a month. I think for instance a hedge fund would be more appropriate with a 2/20 fee structure.
Mike, in hope of motivating you more, here is another example of what the methodology can do for you.
After the Livermore Challenge’s 2nd act, which made its point quite clear, there was only one question left opened and that was what about the other data set, the third data set, presented way back in the series. Again, only one way to know and that is to run the test using the same script. So here it is:

The same kind of observations can be made as for the two previous tests on this same script. High profit to loss ratio. Relatively high compounded annual return. The sum of all stop losses amounting to about 1% of total profits.
You still don’t know what the future will bring. You still don’t know which stocks will outperform. You still don’t know how much profit any of the stocks will bring. But based on your preset trading behaviour, you know what you are going to do when the price of the stock triggers one of your entry or exit points. You did pre-program your whole trading behaviour from the start after all.
This will end the presentation of my tests on the modified Livermore Master Key script. The rest, meaning going to higher levels, will go private. I now have 6 scripts picked from the old WL 4 site modified to my trading philosophy that perform similarly to the above table; a couple much higher. The common point in all those script was that a loose definition for a trend was used. None of the original version produced impressive results, some were even dismal. Nonetheless, they included a trend definition witch after many modifications I could turn into a usable definition for my purpose.
Good trading to all.
Size:
Color:
During the weekend, I converted yet another legendary script, this time based on the Turtles of the 70s. Turtles version 3.1 is a trend following system that plays long and short which at my current level of implementation should have a few lessons to teach; at least I hope so.
My first iteration without modifying its trend definition but adding some of my own trading procedures produced the following table on the first data set as presented in prior posts. I’m showing it simply because it is within the same performance range as the first few simulations. So here it is followed by a typical WL generated chart:


The numbers are not as impressive as in the Livermore challenge. Nonetheless, I do not like the numbers. There are too many big stop losses (59% of trades), only a 41% hit rate. It is a nerve racking trading method. When applied at the portfolio level, as in this simulation; the portfolio must swing wildly on a daily basis. It certainly is not my style of trading.
So what I will need to do is first modify the trend definition to better suit my purpose and then try to reduce the stop losses as their cumulative sum is even higher than what the script produced. Here is the original version of the script on the same data set for comparison:

Performance wise the original Turtles V3.1 script performed just slightly better than my previous selections. However, its wild swings should have been evident from the start. I just started first with my modifications to the script before viewing the original’s version performance.
Don’t get me wrong, I won’t discard the script because I don’t like how it behaves, not at this level of compounded return. I’ll just add more of my trading procedures to get to where I want to go. The trading method has a high cash equity value and plays long and short which I think when combined with some other of my scripts should increase their performance.
Hoping only that what is presented can help some that have tried to design and implement their trading strategies along the lines of the Alpha Power methodology.
Good trading to all.
P.S.: This post has been modified following having noticed that the script started with a 1M initial capital instead of the usual 100k. This did not change the trades, only the return calculations which have been adjusted accordingly. The performance results are more modest naturally. Sorry for the mistake.
Size:
Color:
Is it possible for you to give an example of the implementation of "Alpha Power concept" in Wealth-lab script ?
I have read with attention your documentation but as I'm not a mathematician, it is not easy to understand.
Size:
Color:
After my error on the initial capital in my last post, I realized that the script was operating as if on the 100k starting point while 1M was available. I wanted to know what would have been the results had the equations been adapted to the excess equity available. There was only one way to find out and that is to redo the test with the added capital. Having my trading methodology scalable it should also provide a glimpse on that attribute.
While at it, I added a few more trading procedures to increase performance like putting a little bit more pressure on the system.
Here are the results:

Remarkable performance. Scalability ok, added procedures ok, full excess equity utilization ok. Now the numbers look more like the ones before my snafu. With results like those above, this makes the script more than ever a tool for a hedge fund.
The overall return is impressive and I still have some work to do. It’s like the short term Turtles’ trading methods are at times overwhelming my accumulative functions. The above table ends mostly in cash as most of the trades have been closed except for the most recent ones. As said in the previous post, this script if coupled with another script with a stronger accumulative stance could provide the funds to technically reinforce both scripts.
This iteration of the script has a 61% loss rate therefore the win ratio comes in at 39%. The main reason for this is that the turtle method is too fast in accepting a stop loss; other methods should be used to control when they should be taken. Often, the turtle strategy enters long at tops and short at bottoms only to see the prices revert and produce losses. I’ll find ways to correct this deficiency too.
The Turtles’ trading strategy requires nerves of steel as it swings wildly; however, with an over-diversification approach as in my trading methods, the losses can be considered just part of doing business.
Meantime, my new version of the Turtles script will be excused for reason of performance.
abegy, sorry but no code. I think it is quite understandable.
Good trading to all.
Size:
Color:
Here is my latest research paper. It is all about my quest for alpha points. After all the research, last winter was finally the time for my implementation phase using real market data. A lot of this continued search has been documented; almost real time in this thread. For those that followed this journey over the last few years and wondered how the alpha power method would do with real market data, please note that all the above tables show that performance results exceeded theoretical settings. I think the reason for this is that the market shows a lot more volatility than was used in my randomly generated stock prices. And since the methodology trades over market cycles of significance while still having for objective to accumulate shares for the long term; each cycle is pumping cash in the system for the next cycle which in turn will accumulate more shares.
We are all on the same quest and that is to outperform the long term averages: to gain alpha points. As your own research must have shown, these alpha points are very hard to get and the higher you go, the harder it gets.
I often describe my methods as mini-Buffett style in the sense that you do the same philosophically as Mr. Buffett but on a mini-scale: a lot less equity. See my earlier paper:
The Trading Game, where a comparison is made on the similarities of trading techniques. However, starting small does not mean that you can not grow big.
This new paper adds more insight into the trading methodology as well as a simplified view of its governing equations. In my opinion, all this affirms that there is another frontier beyond the “efficient market frontier” and it has an increasing Sharpe ratio.
Hope it can be of use to some.
Good trading to all.
P.S.:
All the simulation tests were done on the old WL4 site where you can only provide your script and the stock to test on. All trades were done at least at bar+1 with some scripts even using some randomly generated entries.
Size:
Color:
Made another test yesterday that I think some might find of interest. Its description, performance results and charts are made available
HERE.
Hoping it can give a different insight.
Good trading to all.
Size:
Color:
Very interesting test. I was trying to figure out average holding period, but since you increase the holdings during some of these trades the data I calculated was probably not relevant. The results are phenomenal! I can not wait until the fall to get back into this work. BTW, I really like your new site.
Size:
Color:
Hi Mike,
Nice to hear from you and thanks for the kind words. Hope you get back to your implementation phase as from what you already presented you are on your way to finding a solution that can fit your own vision of the trading game. You already know how hard alpha points are hard to get…
First, to answer your question, I do not see much of the past data, only the last 11 months. So my response will be in relation to my controlling functions as I often use lots of random entries and therefore can only express my views in terms of what I expect on average.
My last two simulations (ADD3 & Trend Study II) operate quite differently; in the number of trades and in the profit acceptance functions. As you have already expected, the average holding period for longs is relatively long while the average holding period for stop losses is relatively short compared to the number of bars held for the long positions. As for the positions accepting an early profit instead of waiting it out, the holding period varies a lot; but mostly mid to long term would be an appropriate estimate. And this also depends on the strategy being tested. Several modified scripts have been used to show the point that trading over an accumulative holding function can increase performance way beyond the Buy & Hold strategy. You must have noticed that there is a definite progression in performance from the very first test using real market data to the very last one as I crank up the pressure on objective functions.
The last script is not a lucky script, it is a representation of a total trading philosophy backed by my mathematical model that says explicitly that the way to outperform is to design better holding functions, not just better selection or better trading functions. It is only a slight change in perspective but it can make quite a difference in trading execution.
All my scripts tend to accumulate shares for the long term and in this respect are not different from a Buy & Hold strategy and have, just like Mr. Buffett, the same preferred holding period: forever. But then again, prices fluctuate so much, that a nice short term profit at times will supersede statistically what ever the long term trend could produce. Therefore, why not accept the short term profit and try to re-accumulate shares from that point on for the long term. The idea is to pump cash in your trading account which will reinforce profitable behaviors by giving you the ability to purchase even more shares for the next price swing which you will hold for the long term or be forced to accept even more profits giving you the ability to purchase even more shares for the long term...
So my advice is: kept it up. Start at the end of the game, look back at what you would have done had you known what was going to happen and then design trading rules as if the future was unknowable as it is unknowable. You will be faced with two choices: you put it all on the line on the single stock that will outperform all others or you spread the risk on an over-diversification approach.
I am not that good at picking stocks, so I opted for the second approach with its constraints, drawbacks and opportunities and based on my simulations on real market data it appears that my choice may be the way to go.
Regards
Size:
Color:
The following is for Mike Caron.
Hi again Mike,
Your last question was answered only in general terms as I did not bother in the past to collect the data on the average holding period since my trading methods accumulate shares for the long term.
Therefore, I had to do another test to find out. But that raised another problem: the figures would differ not only depending on the script I would run but also from test to test using the same script as I often use randomly generated entries.
Doing the same test just to collect the holding period looked like a waste of time. And since I was working on other enhancement functions, I preferred to undertake a new test and take note of the average holding periods as I went along.
The following graph is taken from my latest test on my modified version of the Myst’s XDev script:

What this graph says is that in general, stop losses are taken quite early; in 10 cases within a week’s time and in over 2/3 of the cases in less than 14 weeks. The number of bars held for losing positions decreases exponentially over the tested group with an R-square of 0.96. It should be noted that the small group of stocks having been held for a longest time with losses have a high probability of still being in the portfolio and are simply unrealized losses with the potential to maybe recuperate somewhat.
The average bars held was 564 for profitable trades with a minimum average of 225 and a maximum of 812 out of the possible 1500 bars. I find this quite reasonable as all the early trades are being sold with a profit to finance the acquisition procedures. It’s like a rolling profit window which feeds back cash in the system to acquire more shares. This is why the high number of trades (on average about 2 600 per stock) and at the portfolio level 110 000+ trades over the life of the portfolio. This is also why my trading methods need to be automated and fortunately that is what our scripts are designed to do.
Overall, the performance metrics were very interesting as can be seen below:
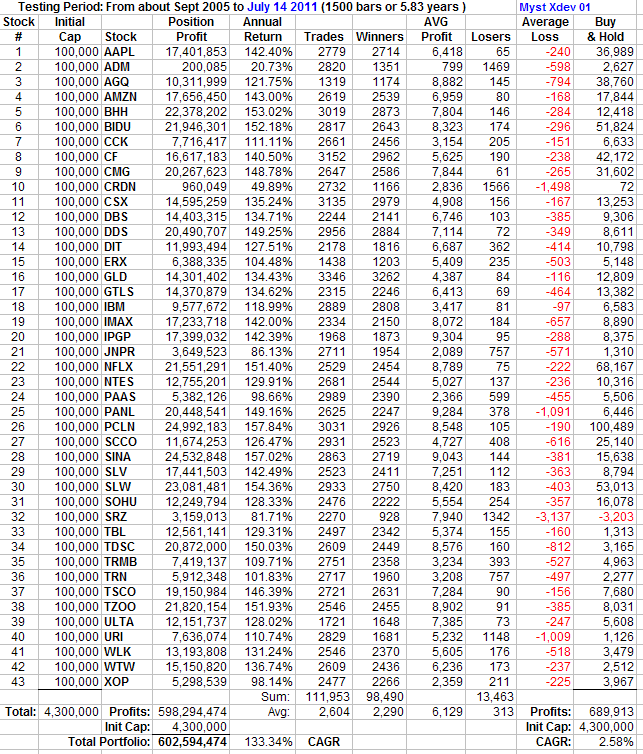
One other interesting aspect of this test is that when you sum up all the losses for all the stocks in the portfolio they represent about 2% of total profits generated and a lot of it in still opened positions. Almost as if you are being charged a small fee for doing business. Also, the method has an 88% hit rate which is very impressive. The system traded over 98,000 profitable trades with an average profit of over 6,000 per trade; while the some 13,000 losing trades averaged a loss of about 500 each, a 12:1 profit factor. It might not be an orthodox method, it misbehaves at times, but then I do like the numbers.
Mike, I hope it answers your question more precisely and help you find new motivation to undergo your own research. The alpha power methodology is not a lucky script here and there; it is a trading philosophy backed by a complex yet simple mathematical model which when looked from a common sense point of view has for conclusion: I knew all that.
Regards
P.S.: This new test will be presented shortly on my new web page with more details.
Size:
Color:
After doing the Myst’s XDev simulation of a few days ago a few questions popped up. Would the stop loss distribution be the same on another data set? Does this modified script have enough general properties to be extendable to another data set? Would the performance metric average about the same?
Questions that can only be answered by doing another simulation on a different data set, and still having the need to compare to previous simulations using other scripts, the 2nd data set was chosen.
The following graph is taken on the same basis as in the first tested modified version of the Myst’s XDev script:

The graph has the same message as in the first test. Stop losses are taken relatively early on average. Again, the number of bars held for losing positions decreases exponentially over this group having an R-square of 0.97, an indication of a pretty close fit. Just as in the first test the small group of stocks having been held with losses for the longest time have a high probability of still being in the portfolio and might simply be unrealized losses.
Again, the unsorted version of the above graph does not show as well the loss concentration in just a few of the stocks or the concentration of very small losses at the other end of the spectrum:

The average number of bars held was 541 for profitable trades with a minimum of 258 and a maximum of 769 out of the possible 1500 bars. I find that these numbers are similar to the previous test.
The total number of trades for this data set is a little less; averaging some 2,300 per stock over the portfolio life with a hit rate of 84%. As in the first test, the sum of all stop losses and unrealized losses amounted to about 3% of the total profits generated by this system; again, in line with my previous test.
Overall, the performance metrics were also interesting as can be seen below:

The system traded over 99,000 profitable trades with an average profit of over 5,700 per trade; while the some 19,000 losing trades averaged a loss of about 547 each, a 10.5:1 profit factor. Considering that the script hasn’t been trained on this particular data set, having seen the data only once and only during this test, the performance results are outstanding. Even if, in my opinion, the method misbehaves at times, I still like the numbers and the way it operated over these two different data sets. To me, it is just another proof of concept; that my trading methodology has real merit and I also presume great value.
Good trading to all.
Size:
Color:
Hi Roland, thanks for doing the analysis. I found it very useful.
I am starting to get back into it. Trying to figure out how to use the GALGO GA software, and then use it time series data. The 100 degree days have helped!
Size:
Color:
What happens if you start with an account size of only $430,000 and your commission rate is $8 per trade? My thinking is that 120,000 trades in 6 years (or 20,000 in the first year) will just about eliminate any average-sized account paying brokerage commissions.
Size:
Color:
Hi Mike,
Glad to hear you intend to get back to work. Someone has to do it you know! You should have some fun developing your own trading methods along the lines of my methodology. I do think you will get there and just as a teaser and encouragement to your renewed efforts, I have raise the bar a bit to show that my methods could also be scaled to performance, sort of.
This new test is based on the Momentum Trader script on the old WL4 site. I did modify it extensively as you would expect, not only in its trading philosophy but also in its trading procedures. My primary orientation was to add more pressure to the accumulative functions (go to level 2) and thereby increase overall performance. Naturally, this would require higher accumulative holding functions; pushing the decision surrogate to trade more often and with a higher trade basis subject to available excess equity.
The following graph is taken on the same basis as in the modified version of the Myst’s XDev script:

The above graph again shows that losses are highly concentrated in just a few issues. In most cases, the underwater stock holdings are still active positions being part of unrealized losses. Almost all holdings in this portfolio have seen red at one time or other. Managing drawdowns is also part of portfolio management.
This time, the average holding period was 589 trading days with a maximum average of 814 and a minimum average of 208. In 11 cases the stop losses were taken in less than 10 trading days. The profit to loss ratio was 14.99:1, which in itself is more than outstanding for this level of trade (over 200,000 positions taken over the portfolio’s life, talk about a need for automation).
The table below summarize the performance metrics and show a 91% hit rate which is also remarkable. The sum of all losses, realized as well as unrealized, amount to less than 1.7% of the total generated profits: an outstanding performance as well. To achieve this level of performance, it was required to almost double the volume of trades compared to the Myst’s XDev modified script. But overall, it does appear to be worthwhile.

As you push for higher performance, you observe that trading volume increases, average profit per trade declines slightly on this increased volume while the sum of all losses represent less and less, percentage wise, of the total profits generated. It is not that you lose on some trades; it is that you win so much more on the added trade volume.
Mind you, all this is done without predicting future price movements, but nonetheless taking advantage of any price swing no matter how it develops. The above table does demonstrate that my trading methods as elaborated in my first paper in 2007 are more than just an interesting concept; they are worthwhile trading methods that can help you gain alpha points that in turn will help you outperform the Buy & Hold strategy and by a really wide margin.
So Mike, keep it up, I have confidence you will get there.
Good trading to all.
P.S.: I hesitated a while before deciding to show the above performance results and finally decided to put them up. I’m promoting a concept, a different trading methodology that has great potential as can be seen by the various simulation results that appear in this thread. Basically I’m promoting a single equation: equation 16 of my first paper. Therefore, to show its merits, I should let others see what it can do.
Size:
Color:
Hi Robert,
Very interesting questions.
First on the old WL4 site, commissions of about $20 round-trip are already included in the calculations. Second, as I have mentioned before, my methods are scalable up or down, and this would not change much as you would get about the same results percentage wise. I would be more interested in the scenario of increasing available capital by a factor of 10. But, reducing available capital by a factor of 10 would also require reducing the bet size by a factor of 10. Since my methods use over-diversification as a means of reducing risk, this would imply making 500$ bets which in turn imply most often odd lots. Therefore, commissions as a whole would represent a higher percentage over trading operations.
As an example, in my previous post, already some $4,000,000 was charged in commissions over the life of the portfolio. And still, all the losses including unrealized losses amounted to less than 2% of total profits generated. The methods feed on market swings, pumping cash in the system for the sole purpose of acquiring even more shares on the next swing. And the system is designed to make full use of excess equity buildups.
My trading methods are progressive in nature; they start small, place small bets and wait for the next opportunity. It is with time that volume increases and volume will increase only if you register profits to fund your next buy. It is a gradual process. The intent is to have the stock inventory on an exponential curve.
This does not say my methods do not suffer drawdowns; they do just like everyone else.
Regards
Size:
Color:
This is not done often on this site, but I had to share. So follow the link to a TED talk where Slavin present algorithms. It is quite interesting...
Link to Slavin on TEDKevin Slavin argues that we're living in a world designed for -- and increasingly controlled by -- algorithms. In this riveting talk from TEDGlobal, he shows how these complex computer programs determine: espionage tactics, stock prices, movie scripts, and architecture. And he warns that we are writing code we can't understand, with implications we can't control.
Size:
Color:
The problem is that with $5000 lot sizes, you only need 0.4% gain to offset the $20 round-trip commission. However, the $500 bet needs a whopping 4% gain to marginalize commissions. It's a big difference that may not allow the strategy to reach critical mass with a smaller account. For this reason, it seems that a large account size (on the retail level) is required to produce these outstanding results. Anyway, it would be nice to see that comparison.
Size:
Color:
Hi Robert,
To answer your question would normally require redoing a whole test which does take time. However, simply by presenting one stock with and without bet reduction should be sufficient to make the point. The two following charts are for AAPL as in the last table. The second one had its bet size reduced by a factor of 10 as requested. Notice that the same number of trades have been executed as expected and a slightly reduced performance since as we both noted commissions would represent a higher percentage when using smaller lots.
Without bet size reduction (same as last test, see table).

With bet size reduction by a factor of 10.

Hope it answers your question.
Regards
Size:
Color:
Call me skeptical, but using AAPL (this century) as a proxy doesn't convince me. Nonetheless, the effect on overall profit is noticeable, but certainly not as great as I thought it would be.
Size:
Color:
Hi Robert,
I understand skeptical, but I thought you wanted to see if the method was scalable. Reducing the bet size by a factor of 10 did in fact reduce profits by a factor of 10; a little bit more due to commissions representing a higher percentage and thereby reducing progressively, bit by bit, the rate of ascent.
That it be AAPL or any other stock in the list would have produced the same conclusion. The number of trades would have been the same and generated at the same time they did in all the stocks. Being a little lazy on the side, I took the first on the list as it was sufficient to make the point of scalability. The result will be the same as well for all the other stocks presented in the other data sets. At least it saved me the time, or the need, to run a new test.
You want to scale down by 10, remove a zero from the bottom line; and to account for the greater impact of commissions, take 5-10% off to give you a ballpark figure. By the way, commissions were not affected by the bet size reduction; the same number of trades was executed in both scenarios. Increasing the bet size by a factor of 10 would however tend to increase commissions but then again, commission costs would represent a very miniscule percentage compared to the new bottom line.
I develop strategies according to the philosophy presented in my papers. I trade equations, scaling factors and exponential objective functions. In this regard, using my simplified equation 16, as presented in prior posts, I tried to rebuild the numbers that would have produced the performance results in the table. Here are the numbers I think appear reasonable:

The above settings give about the same performance level as the last table presented. The bet sizing function is really on an exponential with a 3.5 reading. The trading component is extracting profits from market swings at an incredible rate. How could you achieve such performance results without pressing the pedal to the metal so to speak? This is not the optimum, my current trading methods even though scalable totally lack finesse, operate like a bulldozer. Refinements are for a later stage. But nonetheless, there is always a decision to make: do I take the loss, do I take the profit or do I hold for more or for less? In this regard, I think that the compromise I have achieved in developing this trading methodology is more than worthwhile; it is “a” way to outperform the averages.
I am still in the implementation phase; running different strategies with different trend definition that I adapt to better suit my purpose. The objective is to find which one I like best. And currently, the Turtle method does not lead the pack.
Like you’ve said many times: “what ever you have in mind, it can be programmed using WL; it’s a language”. And this thread chronicles my journey in finding better trading methods, better algorithms aimed at improving performance within the constraints. At the same time I’m also exploring and trying to find the limits, boundaries and the brick wall in my trading methods. How far can this thing go? For sure, I want to know.
My methods of play advocate very simple ideas:
1. Start by the Buy & Hold strategy and adopt Mr. Buffett’s long term view; prepare, select and be ready to hold forever
2. Take small bets over an over-diversified portfolio
3. Accept short term profits to return cash to the account
4. Use the paper profits to accumulate shares again for the long term
5. Accept stop losses and return what is left to the account
6. Use the profits and excess equity to accumulate more shares
7. Try to increase the inventory on hand as you go (exponentially)
I like to think of this trading methodology as a mini-Buffett style of investing as it does mostly what he does from a smaller scale but at a much higher rate.
Regards
Size:
Color:
Thanks for the thoughtful reply. It's certainly an inspirational topic :)
Size:
Color:
Robert, thank you for your interest in my work.
Recently in an attempt to answer questions related to automated trading systems, I decided to design a short term trading strategy to see the constraints and challenges that might arise. I usually design long term trend following trading strategies, but in this case I wanted to try my hand at very short time intervals and see how profitable such a system might be.
The description would represent quite a large post and in an attempt to limit bandwidth, I invite you to
follow this link. I only hope you will find it interesting.
Good trading to all.
Size:
Color:
Seems like this new post should be moved under another subject area since you are dealing with another type of trading strategy. BTW, I did a quick look at your spreadsheet and thought that $3.7MM was too high for my blood for starting capital. I then took the spreadsheet and starting with $30K in capital, assuming only $0.08 profit per trade (60/40 win/loss ratio), with 3:1 margin for day trading, and in a taxable account making my first tax payment with 40% of the profits after 6 months and repeating every 3 months. I would have to trade with 2 stocks for the first month, then go to 3 stocks and so on. After 15 months, I would have enough capital at that trade margin to be able to trade 100 stocks and have an account balance of about $1.6MM after taxes. Ah, to dream big!
As interesting as this sounds, I need to focus my energies back on the Alpha Power strategy. I am still looking for a genetic programming environment, and it seems like
http://cs.gmu.edu/~eclab/projects/ecj/ (ECJ) will be the likely target. I could not find an environment that also worked with a trading environment.
Size:
Color:
Roland (re: short-term trading strategy):
Once again, I would like to question the basis for your calculations as I did on 4/27 above.
I downloaded your simple Excel sheet and immediately noticed the round trip commission constant of $0.02 (2 cents).
I applied a more realistic commission of $1.00 per trade ($2.00 per round trip), changing nothing else, and I think the wheels fell off the cart.
Correct me if I am wrong or misinterpreting...
Dave
Size:
Color:
Hi Dave, there are other no-frill brokers that cater to the professional high frequency trader and would trade at a round trip commission constant of $0.01. The rates go even lower as the frequencies that Roland discusses are approached. Being that this is a Fidelity sponsored forum I do not want to advocate these other brokers.
Size:
Color:
Hi Mike,
Glad to hear that you are back in the game.
Mike, the Dime Cross strategy can be a high win rate scenario. The real trick here, as mentioned in my article, is in the trade extenders. On what will you base your holding for more decisions? Otherwise, you have a 50/50 game and there I can assure you; it is not the way to win.
So the design of your “edge” is not only important; it is crucial. Since there is no lack of trading opportunities, I would suggest picking some of the higher probability trades like waiting for a 20, 30 or 40 cent cross before entry, selecting to enter on a breakout or using momentum over your trend indicators. You want to be in trades where the other participants can exaggerate a bit more and push the price in your direction by 10 cents or more. Look at price movements under a microscope, look for on what conditions am I able to hold longer, how often does this phenomena holds and what should be done if it does not and how can I eliminate whipsaws as much as possible. You are not trying to predict prices; you are trying to profit from the other guy that is trying to predict prices and most often misses the mark. You are there just for the little extra.
With the spreadsheet you can change the numbers to adapt more closely to your own trading story. Based on your numbers, I would suggest trading 200 to 300 shares 10 times a day holding at most 5 positions at the same time with a 2:1 margin or less. I would select lower priced stocks to reduce the average price of the group to around $50.00 or less which would also reduce capital requirements to some 37k or below. Mostly I would look at ways to increase the “edge”.
Playing BGU, SSO, FXI, TNA, XLV, TZA, SH, QLD, UPRO, BGZ, ERX, DDM, UYG, TVIX, SQQQ, URE, DIG, TYH and TQQQ at their current prices can provide you with a lot more than just 10 trades a day and more than a dime on average. The real intention here is to have the computer do all the work. Your role is one of surveillance, for the just in case something goes wrong.
As you know, my average holding period in my other strategies is over 500 bars and that makes them very boring even if they are profitable. So I designed the Dime Cross for the daily excitement and at the same time to see if I could outperform the longer term strategies using a very short term trading one. Well, this is not it, long term some of my other methods will outperform the Dime Cross, however, it does provide short term excitement. My other objective was to see if I could design a system that could make 1,000 to 10,000 trades per day as this too might be of interest to a hedge fund and certainly would have to be automated and forcing me to design all the protection needed in live automation.
Note that starting with a small stake, the Dime Cross, with your own modifications, can be a low risk method of implementing an automated trading strategy where you gradually increase the number of stocks to be traded, the number of shares, and the number of times per day while at the same time trying to improve your edge. And as the capital increases, you can make small adjustments to improve performance while still operating at the same low risk level.
Good trading.
P.S.: Hi Dave, see Mike’s answer above. I did used one cent per share in the calculations. So definitely keep the wheels on the cart… ;)
Size:
Color:
This post is intended for MikeCaron, but I believe other followers of this thread might find it interesting.
Hi Mike,
I hope your research is going well. I thought you might like my latest research notes as they could help you in your own search for better trading systems.
This link points to part 2 of my notes on seeking alpha. It covers basic math functions as presented in my previous papers and gives an example of one of the formulas in action which ends up buying Berkshire Hathaway for $20,000 and still finding it expensive!
I'll be starting soon on part 3.
Hope you enjoy. Trade well.
Regards
Size:
Color:
This article is a follow-up to the preceding post. It covers some interesting points that can help in the design of trading strategies. Its main purpose is to show that one can develop highly profitable strategies simply by slightly changing the point of view.
It centers on the concept that one can trade short to mid term over a stock accumulation process and thereby outperform the Buy & Hold.
Good trading to all.
Size:
Color:
As a follow-up to an
AAPL chart I posted somewhere else, which I must say had very impressive numbers, I've tried to push the envelop a little bit further with the charts listed below (from data set 1, a need to compare again...). I think it would have been very difficult to trade all these charts by hand; therefore they do stress the need for trade automation. Each stock started with 100k (as per the old WL4 simulator), which means that with 1M, one could have traded the whole group. The purpose here is to show that trading over a share accumulation program can have desirable side effects; and also to show that the above AAPL chart was no fluke, a one of a kind.
The trading procedures were performed according to mathematical functions. They just did what they were programmed to do from the start. The functions had no notion of what was coming and could not even try to predict where future prices would go. However, to work, these functions did need a trend definition since technically speaking the buying would be done on the way up using part of the accumulating profits if available. In some cases you could liquidate the position if you wanted to, with a profit, even after a 50% price drop, as shown in a few of the charts.
AAPLAMZNBIDUCMGIMAXNFLXPCLNSINASLWTZOO All the charts are based on the same program version (tested on WL4 simulator) where an uptrend is defined as 3 up days in a row (not the greatest definition, I agree). It was sufficient to go up by one penny to have an up day. I think that close to half of the trades were the result of a random function, could be more or less (still, a lot were random), I did not keep track of trade origination. By increasing parameters to the governing quadratic equations, you can increase trading volume and the number of trades which is, I think, the main reason for the above average performance. You can find these equations in my papers. The reason to increase the trading volume is explained in my most recent article (On Seeking Alpha (
Part III )).
It is not by buying Enron or Lehman all the way down that you can succeed; it is by buying AAPL all the way up. It is very easy to determine which is which: one's price is trending up, the others are trending down.
Hope it can help.
Size:
Color:
I've prepared a little document on back-testing using the old WL4 simulator. Some might be interested in following
this link.
I used as starting point a published script: One Minute Bollinger Band System, which I think broke down after its release in 2004. I can understand the reasons why it performed poorly as it was only playing for peanuts.
I opted to modify the script in stages, adding procedure after procedure and recording the produced charts by the Wealth-Lab simulator. And for a finale, I ran the improved chartscript on the same 5 stocks that were used to present the script in the first place.
My objective was to add trading procedures that would increase the number of profitable trades. They are not all profitable, but you will see as the script evolves, that the increasing number of trades does highly correlate with the added performance.
Hope it can help.
Size:
Color:
For the few following this thread, I’ve just finish a short piece explaining the basis for my trading philosophy. I think I provided additional insight into the origin, motivation and development of my methods. I know you all know the stuff that is used to make my argumentation. I could not achieve what you see on my simulation charts without using everything that is being discussed in
this article.
Hope it can help.
Size:
Color:
This is mainly addressed to Mike Caron.
Hi Mike,
Hope you are doing well in your research.
You might find in my latest research notes some ideas that could help you in your own quest for better portfolio performance.
From last April, back-testing on real market data, I started with a high reliance on a trend definition, having a trend-following methodology. As my tests evolved, the trend definition was getting less and less stringent until my latest simulation where no trend definition is used. How is that for a trend-following method? You can find the note here:
Trend or No Trend .
You might also be interested in my short note on
trade acceleration. In it, I make the case that once you have found an edge; your objective is to repeat that type of transaction as much as you can. You even have a view of the process as I was adding new trading procedures to capture more and more trades.
Hope it can help you.
Regards
Size:
Color:
Here is an interesting experiment. I designed a trading strategy that is mainly ready to execute random entries (95%+ level). I have also added a choking factor to limit its libido. Otherwise it would jump all over the place. The series of charts that follow start with total choking and go to totally free to roam all over. Naturally the number of trades generated is highly correlated to the degree of choking. Even at its highest degree of freedom, commissions would amount to about $20k. I find it inconsequential as in the trade execution some $200k has already been charged in commissions. And when looking at the final results, $20k or $200k would not make that much of a difference especially when the $200k has already been paid.
AAPL choking 100%AAPL choking 80% AAPL choking 60% AAPL choking 40% AAPL choking 20% AAPL choking 0% The procedures used are very rough, like bulldozing all over; no finesse, no style; but it’s not a beauty contest. However, the trading procedures do seem to say: let it all loose.
Good trading to all.
Size:
Color:
Just in case anyone thought that the previous example could only apply to AAPL and therefore was just some kind of aberration of nature. I've simply tried one more stock once and decided that what ever the outcome that was what would be posted. So, with no further ado, here are the results on the same program as the last example on BIDU.
BIDU choking 100%BIDU choking 80%BIDU choking 60%BIDU choking 40%BIDU choking 20%BIDU choking 0%What you see, especially in the case of where random trades are free from all constraints is that maybe the exact definition of an entry rule might have an over-estimated reputation. Naturally, if your system performs better than the free to roam version with no choking of the random process; well, I must say, welcome to the club.
Good trading to all.
Size:
Color:
Thought that, maybe some might be interested in my latest test. It is an experiment in random entries where some 27 procedures battle for a position but are allowed emerging only when the result of a random function let them free. In this case, the random functions permit almost all procedures to roam free.
The test was the logical next step to the last post:

The data set used is the same as shown in many previous tests using other strategies (always the need to compare behaviour and performance). My research notes on this test are available here:
More Random Entries .
Hope it can help in your own strategy design.
Good trading to all.
P.S.: I usually design scalable scripts, this is no exception. You want 10 times more at the output, simply put 10 times more at the input.
Size:
Color:
Following in step with my last post, I opted to improve further my trading procedures. My intent was to provide a smoother transition from trade to trade and at the same time extract a bit more profits. It is a tall order when you look at the already high level reached in the previous test, especially since all the procedure modifications have never been applied to any of the stocks in the list. So here are the results:
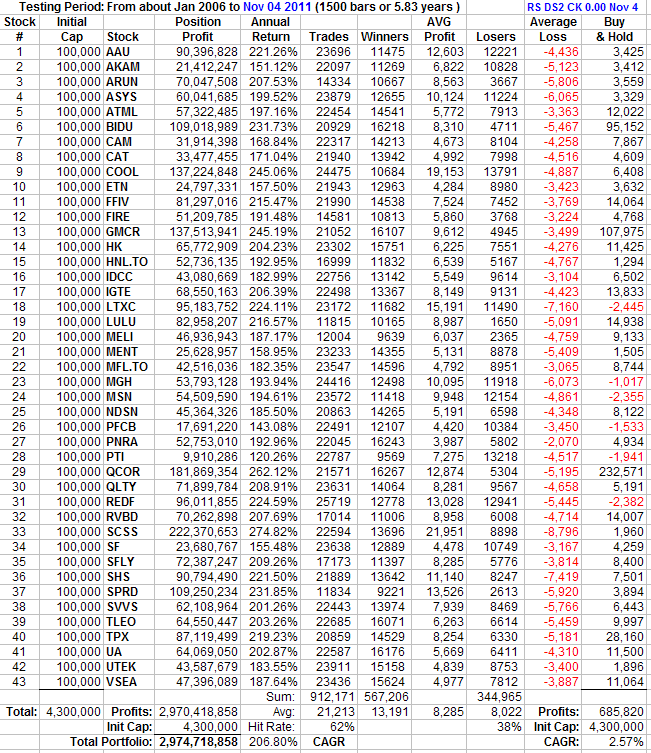
From the table above, I would have to say: objectives reached. With the number of trades generated, there is no other way but to use trade automation. The results might sound exaggerated but when you average everything out it translates to about $3,000 profit per trade or about 20% profit on each $15,000 bet.
All the charts generated can be viewed here:
Random Entries III.
Good trading to all.
Size:
Color:
That is a jaw-dropping return! Anything over 40% APR on trading stocks using daily prices without leverage is impressive. So, now that you tweaked your trading system, what kind of returns would you see on your original, randomly generated data? I need some goals to shoot for.
I have been fooling around with a AUD/USD scalping strategy that simulated seems to do 100% a year as measured by 1,200 trades in 10 months. However, automated paper trading it over the last two days has yet to catch a single trade. Makes me wonder if this really works or if there is something funny in the simulated results.
I definitely need to get back to your approach, which will probably take about 3 months more work. ECJ still looks like a promising platform for this work.
Size:
Color:
Hi Mike,
Welcome back, nice to hear from you again. As you can see, I have been trying to improve too. If you liked Random Entries III, you are going to love Random Entries IV. In it, I try, well I should say succeed, to show that you can double your profits simply by doubling your initial capital. This way you can double your bet size and consequently double your accumulating profits. As a result, the search for more initial capital is more than worth it. So just for you so that you can have fun, here is Random Entries IV:

You can see from this exercise that you can spend a little bit more time gathering more funds before undertaking your very own project. It is worth it. It is all expressed in a simple equation. Your job is to transform Schachermayer's pay-off matrix: Sum(Q.*
dP) into Sum(2Q.*
dP).
All the charts were generated using the old Wealth-Lab 4 simulator and can be viewed here:
Random Entries IV.
You said that: <I need some goals to shoot for.> Well, over 95% of the trades in Random Entries III or IV are randomly generated. And this translates to that in my initial research I was just a sissy, prices fluctuate a lot more than my models.
Hope that all this does not frighten you. I believe you can do it. You were already in the right direction. So my suggestion is: push, and then push some more.
With all my respect.
Size:
Color:
On Designing Better Trading Strategies.
The task of designing better trading strategies is either over-simplified or over-complicated. And often times, it is hard to distinguish which one will really outperform.
Investment portfolio management theories abound. But there has been little change over the last 50 years. We have to dare challenge some established barriers like the concept of an efficient frontier, the Sharpe ratio or the efficient market hypothesis.
If we do not jump over these “barriers”, how could we do better than hitting those “walls”?
But these so called “barriers” can easily be jumped over using administrative trading procedures and profit reinvestment policies.
Check the
presentation which will try to demonstrate this point.
Good trading to all.
Size:
Color:
To correct the link to my presentation provided in my last post and at the
same time present my latest research note on optimal portfolios, simply follow
this
new link .
It is the continuation of the Growth Optimal Portfolio series and ties in
with my latest presentation.. It elaborates on my trading methodology in
more details and tries to show that achieving high performance is relatively easy.
The proposed methods can help, I think, about any trading strategy.
Size:
Color:
In my ongoing research, I have taken a step back; trying to better understand
the mix of trading procedures I use as viewed from within a global trading
strategy. Questions like: what is the main long term objective of the trading
system? How should it evolve in time? Would any trading strategy benefit from
my methods? My first step in answering these questions is
here .
Hope it can help.
Size:
Color:
I'm in the finishing touches to a research note that I think will help most understand how to improve their own long term trading methods. It will be rather elaborate but I also think it will be missing its own premises as that was provided in a prior research note.
So to better understand what's coming, I would suggest a glance at the
Optimal Portfolio VII of the series.
There you will find a refined view of the foundations on which all my trading methods are based. I have tried to treat the whole trading history of a stock portfolio as a monolithic block, something like manipulating 100 stocks by 5,000 trading days matrices. Trying to find trading methods that would apply to whole portfolios at a time.
This thread was started in 2008 and the claims made in its very first post are still valid today. It was only in April 2011 that I started doing simulation on real market data using WL. And I have chronicled here my research almost every step of the way.
I think that Optimal Portfolio VIII is bound to help most design better trading strategies by slightly changing their vision of things.
Happy trading.
Size:
Color:
This past week I wanted to show that starting from an ordinary script, one could improve on the trading strategy by designing better procedures. Keeping with my underlying trading philosophy, and at the same time wanting to evaluate an existing script, I selected the Ichimoku Kinko Yho script. It contained some surprises.
The test based on the original script is available here:
Ichimoku Kinko Hyo While the improvements to the script will be shown here:
Improving Ichimoku KinkoMy intention is to keep on improving on the script to reach higher performance levels. Some might find the journey interesting.
Hope it helps.
Size:
Color:
Can a randomly generated trading strategy win over randomly generated data?
To answer the question with a yes, I built a payoff matrix in Excel doing just that.
The interesting part is that even having random trades can produce exponential alpha.

An explanation of the methods used is provided on my
webpage. I will also provide a link to the Excel file used to generate the above chart in a few days.
Size:
Color:
Here is my promised Excel file at last.
What you will find is this file are random trading strategies using random entries and exits over randomly generated prices having drift and outliers (fat tails). It is a working model designed to let you test and explore your own trading methods; even improve on the design. It is very easy to blow up any element of the file, it is totally unrestricted.
So my first recommendation is to make a copy and then explore. Pressing F9 will generate a totally new strategy over totally new price series. Each strategy should be considered unique in the sense that pressing F9 again will result in a payoff matrix that has no chance to reoccur in over a hundred billion years. Pressing F9 will be like generating a totally new future each time. Once you get familiar with what is happening it should then be relatively easy to make changes, scale up or down, add your own non-random trading procedures to the mix and see what happens.
The sole purpose of this Excel file is to let anyone explore the possibility of trading over an accumulative process. I tried to put as much as I could within a 1Mb file. The spreadsheet has about 65 columns by some 340 rows. It deals with a portfolio of 10 stocks over 250 trading days (1 year). My largest file of this type dates 2008, its over 100Mb and deals with 100 stocks over 2,000 trading weeks. However, it does not use random entries or exits. It was used to write my 2008 paper: Jensen Modified Sharpe, it is also where you will find more explanations on the equations used (see pages 28 to 35). So I tried to condense some of the concepts used in that paper into a much smaller package.
The
Excel file is available in my research note which is also where you will find more explanations on its use.
There are many things to learn from this file, may you enjoy.
Size:
Color:
Some two weeks ago I took the SixSignal script, still available on the old Wealth-Lab 4 site, to make the case that a badly written script is just that, a badly written script. I choose the SixSignal script for the simple reason that it had been published in a traders magazine. I like to look at bad scripts, usually you can reverse the logic and obtain better results. But this was not the case. That the logic was reversed or not, it was simply bad.
However, I could transform the script to give it an accumulative stance in order to better adhere to my trading philosophy. A summary of the quest can be found
HERE.
Size:
Color:
A little over 2 years ago I invited my friend Murielle Gagné (aka lowoncash) to join the Wealth-Lab community in order to participate in the virtual trading strategy section. I told her that with time, we would both be in the top ten. She is my only pupil, the only one to have a copy of my trading programs, and she is very good at analyzing market conditions and player attitudes. At times, I would say she is also my mentor.
All this to say that Murielle (lowoncash) is now number uno, and has been since spring. She has the ability to stand still, pinpoint her entries and exits. She might not trade as often as most but gets impressive results from her positions.
So, dear friend, bravo for a job well done.
Size:
Color:
You are right... it will not let you use apostrophes.. hopefully we can get this fixed tomorrow.
Anyway, I am glad you posted! We are certainly looking forward to seeing some forward tests on systems based on your alpha research in WealthSignals. What do you think?
Size:
Color:
The two links below refer to an experiment that was performed live in this forum in June 2011. They trace the history of the Livermore Master Key challenge. Simply search for the date: 6/1/11 for the starting point.
You will find in my notes below the chronicled narrative of the experiment with some explanation as to how it developed and concluded.
The purpose of the challenge was to show that about anyone could improve almost any trading strategy by looking at the problem from a different angle. In this case, as in others I developed, the script was modified to have a long term view of the market, and in doing so, traded short-mid-long term over a stock accumulation process.
Most importantly, the analysis and evaluation of the trading methods used might provide added insight into how your own trading strategies could be improved. At least it is my hope.
.
An Experiment .
An Experiment II
Size:
Color:
Robert (Cone), thanks for the invitation, but I don't intend to make any of my scripts public.
I hesitated to answer your other question on forward testing since I opted to go live instead.
However, technically, forward testing has been done in parallel as a side effect of all the tests performed since April 2011, most chronicled live in this forum. I needed some basis for strategy comparison purposes, and tests were performed using the same 3 data sets, same price series and same time durations. Deviation from expected average portfolio returns would have to be the result of the trading strategies used. And furthermore, I could continue to test, improve on my methods while at the same time managing my live accounts.
As I progressed in my market data testing phase, I was looking for only one answer: what were the limits of my mathematical trading models? I had set objectives in my very first post in this thread in 2008. I think I have succeeded in showing, in the progression of all the tests performed, that the concept of trading over a stock accumulation program has merit. At least in my view.
Prior to April 2011, all the testing was done using randomly generated prices and it is only after that that I started using real market data to demonstrate my trading methods. Each of the simulations I have done since used the Wealth-Lab 4 simulator. And each simulation had its own set of goals to prove; had its own set of Wealth-Lab time stamped charts as corroborative evidence. I had this need to see how far I could go on the concept of trading over an accumulative process. What would be the requirements, what type of technical background would do best or how could I increase efficiency? Each new test would try to go a little bit further, some starting with known and published trading strategies available on Wealth-Lab and then followed by my attempts to improve on their design (meaning pushing performance higher).
So forward testing: yes, since the same data sets were used and recycled on the 1,500 trading day windows spanning over a year. I was always testing the same thing using various methods in order to show that: trading over a stock accumulation program can generated better profits than just trading or Buy & Holding alone.
I preferred to go live in Sept. 2010, having sufficient data to convince myself that indeed trading over a stock accumulation process worked. I currently manage 3 small accounts which over the past 2 ½ years have gradually increased to an average 40%+ CAGR. I expect the CAGR to continue to increase slowly in time. We both know portfolios go up and down, suffer drawdowns and that it is not that easy to out-perform. And therefore only time will tell if my expectations will continue to be fulfilled, I am of the patient type.
The lessons learned during this adventure is that even if you have a simple concept, like trading over an accumulative process, does not mean that it is necessarily easy to produce a program that will do the job over the long run. It does take time to design, debug, test and structure a trading program to deliver worthwhile results. The trading procedures mattered but not necessarily the entry or exit methods as if being in the game was the first step to consider.
I have simulations with strong trend definitions as if set in stone, some with fuzzy semi-trend definitions where you did not know if there was a trend or not, and even some simulations with no trend definition at all. But all could produce exceptional results (at least in my book). I did simulations using technical indicators of all sorts to using none at all, and still provided impressive performance levels. I even dabbled in random entries which technically showed that about any entry mechanism could have been used since random entries could produce about the same or better results than using any other trading methods. One funny side effects on random entries was that I could have up to 95% random entries but if I tried the 100% level, performance would be cut in half.
It is not by doing what everybody else is doing that one will be different.
Hoping that this narrative can help others design better systems. At least, my simulations can serve as example of what can be done. I know that my methods could piggyback on other program structures and not only survive but thrive. The trading methods I've presented are not the only ones that can out-perform. IMHO, and based on my research, there are out there a multitude of solutions.
Regards
Size:
Color:
QUOTE:
I don't intend to make any of my scripts public.
That's a misunderstanding about WealthSignals. First and foremost, scripts are never shared and are never uploaded. There are three ways to use WealthSignals forward testing;
1. Private Sandbox (free)
Signals and [most] system metrics are private. Eventually a list of all WealthSignals systems will be shown in an author's profile, including private systems to discourage "sandbagging".
2. Public Sandbox (free)
Wealth-Lab.com users can watch the system progress, viewing only closed positions and metrics.
3. Subscriber Network
Wealth-Lab.com users can subscribe for a fee to receive your system's signals.
Of course WealthSignals is hypothetical too, but it's a better verification of forward test claims than just another backtest, and if there's a trading system author that I want to see publish on WealthSignals it is you!
Size:
Color:
Robert, sorry but that will not happen. I do not intend to go the selling trading signals route for the same reason I did not participate in any copycat systems such as Covestor, Collective2 and the like.
Furthermore, there would be a technical difficulty. Being Canadian, I am in a twilight zone regarding Wealth-Lab; I can not have the latest version of WLD, and I can not have WLP connected to IB which is why I still use the old web site simulator. I do not complain, it did force me to design better systems. It is difficult to over curve-fit a system if you can only see a small portion of the data.
Notwithstanding, in all this, you see, and probably most of all, during the whole development and testing process, my research had really only one person to convince.
With my regards
P.S.: I would like to thank you for having kept the old site alive. I found it a major source of ideas and code snippets.
Size:
Color:
There are many ways to look at how to design trading strategies. This one looks at a trading strategy from the view point of a mathematical equation from which a program can be coded.
I think the whole exercise could be beneficial to all as it provides some added insights to strategy design. In the following link you will find a trading strategy based on a single equation (red5) that can serve as some kind of basis for your own strategy improvements.
What you will find in red5 is a controllable long term positive alpha generation machine. It is a “cute” equation which technically has only minor modifications applied to a prior destructive red1 equation. What was achieved is to convert a negative position sizing imbalance into a positive one. Not only that, but giving it a controllable exponential growth outlook. All based on a single equation. Note, I'm not surprised, I have other systems based on equations that are designed to also generate positive long term alpha.
So here is the link:
http://alphapowertrading.com/index.php/papers/157-fix-fractionI hope it can help some design better trading strategies.
Size:
Color:
Feedback on "red5":
I added "red5" to the sell rules of one of my strategies and was able to achieve a small improvement on a 10-year backtest after optimizing, when combining it with the strategy's other sell rules. Using it as the only sell rule, results were far short of the original strategy performance.
Specifically,
1. The unmodified strategy achieves an APR of 45.79% (BH APR is 9.97%). Adding and optimizing "red5", the APR moved up to 46.11%, a gain of .7% (.007). I did drop the original strategy's "Stop Loss" sell rule so it would not interfere with "red5". Of 1,119 sell signals, "red5" triggered 4 on the gain side and 70 on the loss side. 1,045 "sells" were triggered by other sell rules.
2. The best "red5"parameters (for my strategy) were fw%=40, fl%=15, cUp=0.07, and cDn=.05
3. On its own, dropping all other sell rules, the best result was an APR of 23.75%, coincidentally using the same "red5" parameters.
Size:
Color:
Leonard, thanks for doing the tests. I agree with your findings. The red5 program is not designed to outperform someone's best effort, it is there only to show that there should be a positive position sizing imbalance in one's trading strategy.
Someone who already uses over compensation in their trading methods should see little in incremental performance from red5. He should see better results from his own trading methods just as you did. Red5 could serve just as some kind of benchmark to verify that you do over compensate or remind you that you should.
All I can say is: bravo, keep up the good work. You have already exceeded what the red5 program is trying to say and that is: do over compensate and do not use “equal” fixed fraction position sizing trading strategies. At least by over compensating you avoid portfolio deterioration as was shown in the red1 program. The red1 program presented a phenomena that can explain why some trading strategies break down going forward.
By over compensating you can have your trading scripts do even better than red5. And I think that anyone can do better than red5.
The particularity of red5 is that you have an equation, with no sentiment, no prediction and no indicators, just an equation serving as a trading strategy.
My hat off to you. Feedback much appreciated.
Size:
Color:
Leonard, here is something else that might interest you since you already have done some tests using red5.
I've hinted to adding a regulating function for the alpha booster controller (c) in red5 as one avenue of research. It could have multiple uses; like determining kind of a general mood or position sentiment the red5 function could convey.
You feel the market is becoming toppy, then reduce, on the fly, the PT and SL (reduce cUp, increase cDn); it will cause to take profits earlier and have tighter stops (see page 58 of the paper). You think that the market has still some way to go, increase the PT for higher exit prices and reduce SL just in case to tighten stops (increase cUp, increase cDn).
The point is to design (add code) that will control the values of cUp and cDn based on your own views of what the market is going to do, or use some market state indicator to massage the alpha booster controller. Maybe even using these same functions to control your degree of participation in the market like adding a positive feedback loop to the position sizing technique (I use such methods in some of my programs).
Presently, red5 is a trend following system which has 100% market exposure using only long positions. But since red5 is only playing price variations, it could also profit from going short or at least not being long in a down market. So many ways to improve on red5 and design better systems.
The alpha booster controller can act as a joystick, a “mood” slider function, manual or automated, to respond to your general market view. You will see the red5 equation adapt to these different notions. In a funny way, the result would be like having a joystick to play the stock market “game”: a little more for profit targets please, tighten the stops, increase participation, shift in third gear, … all controlled by these two variables. You should get the idea.
The red5 program as designed is for the long term (20, 30+ years) and is compounding over the investment period. The last 20% of trades in the series are the ones that count the most.
At least you know that keeping: (1+PT)*(1-SL) greater than 1.00, will create a positive trade imbalance in your favor. Red5 could be modified to help you control by how much and at will.
It should result in a dynamic function trying to adapt to market conditions: my next area of research.
Size:
Color:
I'm afraid I won't follow that path, for three reasons.
First, my best performing strategies are short-term, holding less than two months, typically.
Second, given that, I don't ever think I or anyone can predict the overall direction of the market in the short term.
Third, and the big reason, is that there is no way to backtest. There is no practical way for me to simulate what I might have thought the market was going to do in 2004.
At the moment, in terms of trying to turn a profit in a bear market, I'm concentrating my energies on developing a complementary short side to my currently long side only strategies.
Size:
Color:
Leonard, I understand your point of view. The point raised was to set back testable regulating functions. I know I will backtest, over the long term, before using any of the proposed solutions.
Size:
Color:
I have read the Alpha Power papers several times. Interesting stuff. Will try to create my own equation based on these papers.
Being a Fidelity customer, I have adopted the dividend re-investment route with my retirement accounts. Dividends are re-invested commission free in each stock I hold. Have been doing this for the last 10+ years. Sort of like Buy & Hold with double compounding. Dividends buy additional shares, plus any dividend increases that companies give out. Plan on living off the dividend stream in retirement, along with SS and small pension.
Using the EZBacktest software
http://ezbacktest.blogspot.com/ I have run many different backtests and allocation models
I took David Fish's spreadsheet
http://dripinvesting.org/tools/tools.asp, sorted the dividend champions by number of years increased dividends. I came up with 53 companies that have increased their dividends 40 years or more. Here are the ticker symbols: DBD,AWR,DOV,NWN,EMR,GPC,PH,PG,MMM,VVC,CINF,KO,JNJ,LANC,LOW,CL,NDSN,CB,HRL,TR,ABM,CWT,FRT,SJW,SWK,SCL,TGT,
MO,CBSH,CTWS,FUL,SYY,BKH,NFG,UVV,BDX,BCR,HP,LEG,MSA,PPG,TNC,GWW,BWL.A,GRC,KMB,MSEX,NUE,PEP,VFC,MHFI,RPM,
UBSI.
I used the following 50 companies for the backtest: DBD,AWR,DOV,NWN,EMR,GPC,PH,PG,MMM,VVC,CINF,KO,JNJ,LANC,LOW,CL,NDSN,CB,HRL,TR,ABM,CWT,FRT,SJW,SWK,SCL,TGT,
MO,CBSH,CTWS,FUL,SYY,BKH,NFG,UVV,BDX,BCR,HP,LEG,MSA,PPG,TNC,GWW,GRC,KMB,MSEX,NUE,PEP,VFC,MHFI.
I started the backtest 20 years ago, and ran to the present day. Based on $100,000 total investment. Each company was equal weighted in the portfolio. There was no rebalancing. Dividends were re-invested back into each company. The numbers speak for themselves.
Portfolio Value as of 2/12/14: $1,011,647.14
S&P 500 Value as of 2/12/14: 383,672.52
Standard Deviation: 13.12
Sharpe Ratio: 0.77
Size:
Color:
Hi Roland,
I have read all your posts but I am little unclear about the following:
" it does show the value of accumulating shares of a rising stock and letting the market pay for it. "
So you are suggesting that the market will pay for the additional share purchase as it rises. How does this work, can you give an example? I understand that you can reinvest the dividends, but discounting any additional alpha generating activities in generating cash to finance additional stock purchase, how else is this done?
Thanks
Size:
Color:
Hi Dean, I think the easiest way to answer your question is to illustrate the point with a couple of charts. This has been presented before, hope it won't offend anyone.
The first graph shows a total financing scenario. From an initial investment, one waits for a sufficient price increase to acquire additional share blocks. In the case of the chart below, at each $50 rise 1,000 shares are bought at the prevailing price. The formula was presented in my paper:
Jensen Modified Sharpe, , starting on page 28 (see fig. 8 for cash requirements). One could choose any other price increment, and using the formula easily determine where no additional capital will be required to sustain the strategy as well as how much capital will be required to do the job.
The chart below shows an example based on Berkshire Hathaway. It was chosen because it is one of the few stocks that had the age factor and had not issued dividends making all the calculations simple from start to finish. Nonetheless, the same principles would apply to any long term portfolio outlook. You intend to stay in the market for 30+ years, might as well look for stocks that can last that long! You think a stock won't survive, don't wait till it goes under: get out on any kind of doubt, there are plenty more out there that can.

In the beginning you won't see much difference with a Buy & Hold scenario, but as prices rise with time, the difference will be phenomenal as illustrated in the following chart which shows the strategy's output up to 2011 (it is higher today, price has gone up $50,000 per share since then resulting in an additional 290B in portfolio value):

All additional shares purchased after the initial position were paid for using the accumulating profits. In this case, no additional capital was required. It's not the only scenario one could use. The equation controls what one does over time and thereby presets all future trades. The point being that you let the market (using generated profits) pay for additional stock purchases over the long term horizon. Each time you purchased additional shares; it was because “all” your previous positions were already profitable. At any time you could quit, and be ahead of the game. The chart shows the later the better.
From the above chart, it makes this kind of long term endeavor worthwhile. And yet, there were few trading rules, none related to what the market does, but to what you did based on the positive price action. The price did not go up, you did not purchase additional shares. Note that if the selected stock did not go up long term, it was not that great a trading stock either. It does force you to look at the market from a long term perspective where you elect to trade on your own terms as another alternative to simply trading short term. As you develop your own strategy, you will start to notice that the same criteria Buffett uses in his stock selection process will also apply to you.
The above scenario has been improved by adding a trading component to the mix and using smaller price differentials. You should note from the above graph that as prices rise, a greater and greater portion of the portfolio is cash equivalent that still remains unused. You could either remove some of the available cash for your own use or use some of it to trade over the accumulative process.
I think this trading strategy should change the way we look at things; it provides a long term plan, knowing from the start that you are going to win and most probably win big. I see it as the same bet as Mr. Buffett: a bet on America.
The improved approach has also been illustrated in detail in the following
presentation. Hope it answers your question.
Size:
Color:
"All additional shares purchased after the initial position were paid for using the accumulating profits." LOL
This assumption is incorrect. Your "unrealised profits" dont allow you to buy more shares at the rates you have suggested (or any rate) in your spreadsheet / papers. The only way to add to your position is by acquiring leverage which not only adds to costs but will destroy your account eventually or reinvesting the dividends which is nothing new...all the additional "Alpha Accelerators", using options, systematic strategies etc are just a pipe dream...
You have idealistic examples in your presentations which are far removed from reality!!! This is a typical symptoms of a self proclaimed guru (or a lone researcher).
Size:
Color:
Roland,
"My methods of play advocate very simple ideas:
1. Start by the Buy & Hold strategy and adopt Mr. Buffett’s long term view; prepare, select and be ready to hold forever
2. Take small bets over an over-diversified portfolio
3. Accept short term profits to return cash to the account
4. Use the paper profits to accumulate shares again for the long term
5. Accept stop losses and return what is left to the account
6. Use the profits and excess equity to accumulate more shares
7. Try to increase the inventory on hand as you go (exponentially)"
Bullet point 4 is where I get confused too. "4. Use the paper profits to accumulate shares again for the long term"
Does this mean selling some of the appreciated shares from the original purchase? Which defeats the purpose of Buy & Hold for the long-term.
Or are you using capital from the sidelines to buy additional shares as the price rises?
I am confused.
Rob
Size:
Color:
Rob, You are not confused, the only person here that is confused is Ronald.
He is printing cash or "ALPHA" "ALPHA BS" etc (lol) out of thin air...maybe he is working for the Fed who know but the whole methodology and all the assumptions are flawed. If it was true, A) he would be a billionaire (and not so lonely) B) the whole web would be screaming out loud his name - and dont for one second think anything in his work is original! Because its not...
Having read his papers, I can tell you all now that his testing procedures are also flawed.
Size:
Color:
Dean, what can I say, that was to say the least, “constructive”.
The formula presented lets you “control” your acceptable leveraging factor without changing much to the long term output (as a matter of fact, less than 1%). And even there it will be to your advantage.
What was presented was close to the minimum capital requirement of an idealized scenario to show that simply buying on the way up using accumulating profits could do wonders long term. It is the same principle at work as reinvesting dividends. The Berkshire scenario is a real life example of what could have been done over the last 50 years. It is not unique; it only provided a case with no dividends and no splits to account for. Other candidates could have been used, but with added calculation adjsutments:

The trading strategy is based on equations which predetermine all future trading decision points. You simply change the parameters to suit your needs, preferences or objectives. The equations should be used as guidelines and adapted to anyone's own desired trading style. It's also just a starting point, there are more elaborate functions that can be added to the mix. You will see these notions covered often in all my papers and research notes. I find it one's responsibility to solve to their own satisfaction any of the little problems they may encounter, especially when they are so easy to solve.
If you find the initial leverage factor too high; one of the simplest solutions is to reduce it to a more acceptable level or simply eliminate its use altogether. The formula is not set in stone. It was designed to adapt. I've always considered the use of leverage as trivial a problem as commissions in this type of long term trading strategy.
For example, in the presented scenario, increasing the initial stake to $100k will have on the second trade a starting portfolio leverage set at 10% which I think might be quite acceptable to anyone. If that was still too high, increasing the initial portfolio size to $200k will reduce the initial leverage factor down to 5% of portfolio. Note that if you add to the initial working capital, you also add to the bottom line down the road.
In the above cases as the price increases, the leverage as a percent of portfolio value, will decrease relatively quickly to less than 1% of portfolio value but would still not reach zero. Therefore, I agree, there will be initially a cost associated with the leveraging factor. However, simply by keeping cash reserves, the initial leveraging can be eliminated as shown in the following chart which covers the first 100 levels:

One can approach full market exposure (leveraging factor of 1.00) from both sides, or have it tend to 1.00 as much as possible. It is all a question of trading style and preferences. I've always considered leveraging trivial since the added portfolio performance more than compensated for what ever the leverage financing was or could be. It is the reason I usually don't consider it; it is of little concern.
Say for the $100k scenario, with a 10% interest rate, I might have to gradually pay up to some $30 to $50 millions in interest payments over the long term horizon. But on the other hand also make 4 times the Buy & Hold on the initial added shares (8,000) giving 4*240M = 960M to cover the added expense. I do think that it more than compensate the added “cost” of doing business. An estimate of the commissions for the presented scenario would average somewhere around $25k, again a trivial sum not worth considering compared to the long term payout (see the chart in my last post).
This trading technique is not a pipe dream, it's more likely just a compromise of sort. For someone not wishing to use initial leveraging, simply put more money on the table, you'll get it back anyway (with interests). How much is one ready to pay to outperform Mr. Buffett 100:1?
I can easily understand that someone is not ready or is unwilling to use equations to direct his/her long term trading decisions. However, I would still suggest that one investigate these equations on their own and find out how they can benefit from them. IMHO, the long term prize is more than worth it. One could simply put 10% of his portfolio on such a long term endeavor, follow the equations at their own preferred settings and find out with time that it might have been their best move ever.
I am not a guru, however, I do agree on one thing: I am a lone researcher; and to my credit, one that has done a lot of research. You will find it chronicled in this thread since 2008, and in this forum since 2004. I've been a lone researcher since the mid-70's, I can most certainly say that it takes a lot of time to do anything worthwhile.
If one rejects right off the bat a different approach, how could it ever profit them?
Size:
Color:
Robert, you asked: “ Does this mean selling some of the appreciated shares from the original purchase? ”. Yes. You have as backdrop the accumulation process described in prior posts to which is added some trading functions. As prices go up short term, you take out some of the profitable trades. This has for effect to reduce your inventory but also to put cash back in your account. After such sales, your trading strategy determines at what price it should restart buying shares with objective to buy just a little bit more shares to replenish your inventory and get back on track to its long term objective.
It will be like having an oscillating inventory over a long term upward trend. In the presentation you can see this process in action.
Size:
Color:
Lets forget about all the formulas and theories and talk about the real world trading, you can create anything you want in formulas, unfortunately they all apply to reality:
You cant simply "buy more stocks with the profits". These profits are unrealized, meaning you cant use them to finance additional purchases. Selling them wont help either, as you will just have to buy them back at the same price or higher (will get less stock)...
Using your own example:
Stock is at $10:
Buy 2000 @ $10 = 20,000
Stock moves up to $60:
Current unrealized value of position = 2000 x 60 = $120,000 - this money cant be used to buy more stock without leverage - period.
Add 1000 shares requires 60x1000 = $60,000 additional cash (which you dont have) - so where is this money coming from? Leverage??
Thats 50% leverage - only on your second purchase!!!
Size:
Color:
Dean, that's what the presented table and above charts showed. Easy solutions to circumvent the use of leverage have also been presented.
You don't want to use leveraging, no problem. Simply put more money on the table and kept some cash in reserve. This has been explained in the previous post. Note that you are only leveraging the new position taken since at any step along the way, you could have liquidated your entire portfolio and bought back exactly the same number of shares at the same price giving you access to all the capital (accumulated profits included). US accounts use marked to market so that you don't have to sell at each level in order to use the accumulating paper profits. Also, nothing stops you from time to time to liquidate some shares for leveraging purposes.
The leveraging factor depends on the new position size taken over the existing inventory. Using a trade basis of 100 shares in the 10,000 shares scenario, will make it 1% leverage which from there will decrease as you increase the inventory; but will also decrease as the price rises to the next level where it will be 0% again before you purchase your next share block at the new level reached. Use cash reserves put aside to compensate for this leveraging if you want. It's only a matter of choice.
What is presented is a slightly different point of view on designing a trading strategy. It lets you explore alternatives based on mathematical equations as trading decision points. A stock price does not rise, the above scenario produces no profits and no additional purchases as should be expected.
When you design a trading plan that is made to last 50 years, you will have to wait a long time before showing some results. Having taken a long term view of the stocks you want to trade in, then you can preset how you would like to deal with them over the years. That's why we design trading strategies. I still won't know what the market will do, or how a particular stock will fair over the years, but I will have set my rules of engagement. To me, it's like saying show me profits, and I'll buy a little more of your shares as a measure of encouragement and as a positive feedback mechanism; the more profits you show me, the more shares I'll buy.
Nobody is being forced to use in any way what I presented. It is up to each one to evaluate if the backdrop of this kind of trading technique is for them or not, or if it is worth exploring at all.
Size:
Color:
LOL.
Everything you claim and preach is known knowledge!
I hang my hat...good luck in the real world!
Size:
Color:
Dean, I wish you luck too. I think you will need it more than I do.
Size:
Color:
Your entire Alpha Power is based on the premise of being lucky, your testing procedure and results you present here are nothing but a delusion, results of sitting in a box for too long! In summary, you are claiming, if you add more Alpha to Alpha you get exponential Alpha, and this is done by having great systematic strategies, options strategies and huge amounts of leverage (if you calculate this correctly) or anything "Alpha" that is Accelerating to generate Alpha on top of your buy and hold Alpha and instead of existing everything, you hold some for the long run --- LOL ---- I nominate you for a Nobel Price in Alpha!
Delusions of grandeur at work...
When you actually start using this BS, you will realize in reality there is no such thing as luck and hence my offer to you!
Alpha
Size:
Color:
Dean, it took me some time to reply to your comments, my first reaction was why bother. Our views are so contradictory that I was not even interested in providing a reply. After this post, I'll go back to my silent mode. For sure, your attitude is not an enticement to contribute. There has been someone with your point of view since I started documenting my research here way back in 2004. So, I'm not surprised by your reaction. Your view point has been expressed, it's nothing new, and I totally disagree with it. My own point of view is expressed below, and after this I expect we should leave it at that.
This post has been written mostly for other people's benefit. My ending advice being: they should try to design better trading strategies, back test them to the point where they can have confidence in what they are doing. It's only after having reached that point, to their own satisfaction, not mine, that they will be able to apply their trading strategies. There is most certainly enough data on this site to help anyone do the best job they can.
-
The stock market is the same for everyone, including me. If luck is the premise behind any trading strategy I design, then let's say for a moment that luck it is.
However, such a premise does not apply only to a single person, it applies to all.
This would have for logical conclusion that whatever trading strategy one devised, on what ever basis, only luck could provide some future positive alpha; (using the term “alpha” to mean outperformance). This alpha would therefore be unpredictable as well. This states that you could not know in advance if you would generate or not some future long term alpha. Why on earth would anyone ever simulate any strategy at all? Based on your comments, even if someone generates alpha over historical stock prices using what ever trading strategy, it would still be just an illusion.
This is where our views of the problem greatly differ.
Your comments imply that there is no use to what ever trading strategy someone might devise using the Wealth-Lab program or any other trading software for that matter. Luck would be the only prevailing reason for one's success or demise. And when luck is on the table, it has for conclusion, that what ever you do trading the markets is just gambling and nothing more.
Not being able to generate alpha, except by luck, is the same as admitting that one can at most expect to achieve the same long term portfolio output as the Buy & Hold strategy which is the “no alpha” benchmark. From such a premise, there is no need to trade, consequently no need to even design a trading strategy of whatever nature. Buying an index fund would be the easiest and surest way to duplicate this no alpha benchmark. Anything else would be akin to gambling or outright speculation.
All the simulation results I've shown in this thread over the years have been done using the Wealth-Lab software; the same program that you have at your disposal. There is nothing new in my trading scripts. It is easy to notice that the output of all the trading scripts presented had for origin somebody else's Wealth-Lab program that I modified to suit my needs.
As a side note, I would like to thank every one of them for having so graciously provided their code, I've used a lot of their trading procedures as building blocks for mine. At the same time, I wish to thank Robert for having kept the legacy website alive and running.
I've studied each and everyone of the 1,800+ trading scripts in the Wealth-Lab code library, extracted code snippets here and there that I found of value and then used some of this selected “library” of trading procedures to modify existing code. Some trading procedures did nothing by themselves, but when combined with others would shine. Some were just adding a little something here or there: more protection in some instances and more daring in others. I had this whole library of other peoples work (years of research) at my disposal where I could extract what ever I needed to design my own trading strategy, hoping with a little luck, to go beyond the original trader's script or intentions.
I thought that if there was one place where my trading scripts could be understood, it was here, in a Wealth-Lab forum. Geez, the guy uses the same tools you have, the same programming language, existing trading procedures that are juxtaposed to one another to produce something that is just slightly different from conventional methods. His whole trading methodology can even be summarized in a single sentence: trade over a stock accumulation process. It is so simple that it has been around for at least a century. And if the methodology had any value whatsoever, it would easily show in simulations over past data, which it does. Programming what is implied in that sentence might be what provides the originality in my programs. Some have been so extensively modified that the original author would be hard pressed to recognize much of the code used. When you are the only one using a particular kind of trading strategy, should you be surprised to achieve different results than most: be they better or worst?
So my point would be: even if your trading strategy might depend on luck; nothing stops you from designing trading scripts that would be luckier than the next guy should luck be on your side. It is why an individual does any kind of back test in the first place. The objective is to design a better mouse trap, but it is also to avoid all those trading strategies that are doomed from the start due to poor or flawed program design or misconception about what some trading procedures might really do in the long term. Don't think that I don't know all the pitfalls of designing stock trading strategies, I have enough experience to deal with these potential problems in my code.
If luck is the dominant factor in playing the stock market game; then the most expected outcome is the same as a Buy & Hold strategy. What I say is: you can play this long term strategy, and add to it some short, mid and long term trading procedures to generate additional cash that can in turn be used to improve further your long term overall performance level. Nothing extraordinary, just the application of some basic common sense.
Size:
Color:
The following might be of interest to some. Over the past few weeks, I've started doing the inventory of some old trading strategies, making new tests to re-evaluate their trading procedures, software routines and performance levels. The object being trying to find the best of the crop.
Both strategies analyzed to date have for origin old published Wealth-Lab trading scripts. The first based on the Livermore Market Key and the second on the BBB System.
Over 3 years ago, I made extensive code modifications to both these programs but never tested them for more than 1,500 bars. So any new test would be like having these scripts see 3 years of their future.
This time, to spice things up, I opted to perform the tests on an entirely different data set by using the 30 DOW stocks which had never been tested using these strategies and then extended the simulation to 6,500 trading days (25 years).
This would show if the trading strategies would break down on their back end 3 years of out of sample data and on the 16 years of front end data, data never seen by these trading strategies which were developed using other stocks for their 6 year tests.
The results are quite remarkable, not only did the strategies not break down, they thrived.
The Livermore Market Key test is available
HERE. It's based on the same strategy that was chronicled live in this thread during my Livermore Challenge back in June 2011.
The BBB System test is available from
HERE. Hope it can help in your own research and trading strategy development.
Size:
Color:
My next trading strategy to be analyzed is called: DEVX V3. It's a strange creature, it designs a none trading zone, will buy below it and sell above it. Very simple in fact. The main idea is relatively old (say at least 100 years).
The original version of this program was developed right here on Wealth-Lab and is referenced as: “XDev Long V1”, originally coded by fdpiech and later modified and republished by Gyro, July 5 2002”.
It could be described as swing trading. However, my modifications to this particular trading strategy has some surprises of its own.
First it is a trend following strategy, as a matter of fact, it depends on trends. And, all its trades are a consequence of random functions. The best way to express this would be: if it's your day today (within the constraints): buy, otherwise abstain. So you have a trend following trading strategy relying on randomness to be profitable. Almost a contradiction in terms, but not really.
It follows my trading methods which can be resumed in a single sentence: accumulate shares for the long term and trade over the process. The simulation is on 30 stocks, almost entirely from the DOW 30. With a testing interval sufficiently long to cover market gyrations of all kinds that have occurred over the last 25 years. And since the strategy does hundreds of thousands of trades, one can not say that the output was by luck alone!
You have a trading strategy that was designed 2 ½ years ago; that at the time saw 11 stocks being tested over their respective prior 6 years of data, that is now being applied to 30 stocks it has never seen before (except for one (IBM) over its 6 years testing period) and now having the testing period expanded to 25 years! What one might call quite a challenge or a nightmare for any trading strategy.
I've also provided the explanations needed for anyone wishing to design such a system. But be ready to say: what was that?
Follow the link:
http://alphapowertrading.com/index.php/papers/165-deviation-xI think that anyone designing trading strategies should at least read my observations on this unique trading system. Not doing so is depriving yourself of “valuable” trading insight that can help “you” better design “your” own trading systems.
If you are not challenged by different ideas, how can you change?
Size:
Color:
Finally finished the analysis of the 4th trading strategy in the series. It's a big file, so the best is to follow the link:
http://alphapowertrading.com/index.php/papers/167-nest-egg-on-supportWhat you will find is the analysis of an old published trading script programmed by Fundtimer in 2006 using Wealth-Lab, so the original program is not mine. How I transformed it to be a money maker however, well that's my doing.
I've not only done the analysis of the program, but also showed step by step some of the modifications brought to the program and the output of those modifications. In itself, its like viewing how and why you make modifications to existing programs to first correct their flaws (compared to your own trading environment) and then to enhance their long term outlook. Even totally alter the very nature of the original program.
This trading strategy became a good candidate that can serve as building block for someone's retirement account. It also provides some positive surprises.
In all, it should be rewarding to anyone designing trading strategies for the long term. This test, like the other 3 already performed, is on the 30 DOW stocks over the last 25 years. Quite a long term test on a bunch of stocks representative of the market. With impressive results.
Size:
Color:
In the same vein as in my previous posts, I'd like the present the following charts from a portfolio simulation done over last weekend. It's huge and I am still analyzing the details involved with such a big portfolio. Its payoff matrix has for size: 13,000 rows (days) by 985 columns (stocks); that's 12,805,000 data entries for each of the matrices involved.
I've opted to use the Elder Triple Screen (ETS) trading strategy as backdrop and testing ground to learn and test my new possibilities using Wealth-Lab 6.6. Sorry, the ETS won't be strategy #5 to be tested and analyzed. I'll most probably use another one for that. The ETS modifications are too much of the chainsaw type of job for my taste at the moment. However, I do need to test and debug using something.
The first chart shows the overall portfolio performance from August 1964 to present (50 years). The simulator's output is impressive:
Portfolio Equity Curve: 50 Years

As before, the blue line at the bottom of the chart is the Buy&Hold. The general shape of the equity curve is similar to the Russell 1000 index. Note that it more than significantly departs from it.
The ETS program was transformed to accumulate shares over the long term thereby taking a buy and hold stance on many of its positions over this prolonged investment period. Yet, the average holding period was just slightly more than 5 years.
The performance summary report gives the portfolio's standing at the end of the test as:
50 Year Performance Report

From the above, 389,586 trades were executed with 81.48% of these showing a profit from closed and still opened positions. There is no Machiavellian process at play here. What you see is simply the output of a trading script designed to accumulate shares for the long term. Notice the payoff ratio and profit factor: both are more than just high.
The following chart reveals even more:
Portfolio Inventory Level (50 Years)

We can see the inventory buildup as time progresses. It does show the exponential nature seen in its governing equation:
A(t) = A(0) + Σ(
H(1 + r + g + T)^t.*Δ
P)
As was said in my 2007 Alpha Power paper (page 6):
“it turns out that there is a whole family of procedures of the submartingale variety regulated by subordinators (as in a Lévy process) that can transform an expected zero alpha into an exponentially increasing one. …In fact, when looking at the problem from of a long term perspective point of view, it is a whole philosophy of trading procedures with many variations on the same general theme that can be used not only to extract some alpha but most importantly to put it on steroids.”
From the equity chart above, any point in time shows the portfolio liquidation value; the net profit after closing all positions and quitting the game. You will suffer drawdowns, but to a lesser extent that the Buy & Hold (percentage wise).
The above test also revealed that much less capital would be required to achieve those goals than anticipated (I would venture from less than half to less than a third). Not all stocks came online at the same time; in fact, stocks were progressively added over the whole interval, and each one was treated differently. Each had their own signatures.
Yet, all the stocks, as a group, would contribute and make you prosper over your long term horizon as if by default. You might not be right on all your trades all the time, but in the end, it might not matter that much.
Size:
Color:
Hello Roland,
Thanks for your work.This is a good thinks to share it with us. I have a question to you.
When I look your last post, I see that you backtest your trading strategy in a raw mode. For this reason, the result is not fully realistic in my point of view because the cash is not unlimited and must be allocated in an efficient way.
Why do you not try to introduce this element in your analysis ?
Size:
Color:
Hi abegy, more than sufficient funds was allocated to the trading strategy even in raw mode. Each stock was attributed $100k. So this would total $98.5M as initial capital to be allocated $5k at a time. In the beginning, $5k bets are gradually placed in each of the stocks. As they prosper, some profits are taken and proceeds returned to the account. Also quite a number of stocks came online a number of years after the start of the simulation. You even have some that came online only over the last year.
The chart with the equity line shows your net liquidation value at all times. It has the same general shape as the Russell 1000 index. It's normal, the strategy is holding a growing inventory of stocks, that the equity line be correlated to the index.
This was not intended to be a trading strategy that starts with only $100k. The system could make 19,700 trades before using all its initial capital allocation. This is not counting moneys returned to the account due to profit taking or stop loss execution.
It's a slow process that gradually place $5k bets. In the beginning, you are less efficient that the other guys that can profit from the short term swings in the market, but as you go along, and as your stock inventory builds, you'll not only catch up but exceed their performance levels.
BTW, these methods have been shown to be scalable. You can reduce the capital requirements by reducing the number of stocks to be traded as well as reduce the bet size. Say your reduce the number of stocks by 100 (≈10 stocks) and reduce your bet size by 5 ($1k bets); this would reduce the numbers by a factor of 500. Such changes would reduce capital requirements to about $200k.
The point I wanted to make in these tests was to show that the methodology could handle a large number of stocks (~1,000) over an extended period of time (50 years). And I think the simulation handled that quite well.
Size:
Color:
Was anyone surprised by the results in my previous previous post?
I know I particularly liked the third chart. What I see in it is a direct consequence of the trading methodology used... Time, more precisely: doubling time, should be a core concept behind any portfolio construct. That you win, in the short term, from a trade here and there is almost totally insignificant when looking at the bigger picture; especially if your trading strategy does 389,586 trades over its 50 years time span.
It's the finish line that matters, the when you will say: I quit and retire. But by then, you might also realize that quitting might not be that great an idea after all. Just letting your computer do its business might matter too... and based on the last 3 charts presented, it might matter quite a lot.
The third chart showed the net number of positions in the account as time progressed. The part in blue below the curve depicts the position inventory accumulation over time. It spans 50 years and represent all the daily inventory adjustments done over the period. It resumes all the trading activity of the 985 stocks. Here is the chart again:
The thing that's remarkable is the relative smoothness of this exponential curve. It started slowly and gradually grew in size. It showed, at a glance, the exponential part (1 + r + g + T)^t of its governing equation: A(t) = A(0) + Σ(
H(1 + r + g + T)^t.*Δ
P).
This equation says that the reinvestment policy g and the contribution from the trading activity T can help push performance to higher levels, all other things being equal. It will be, over time, how one will slice and dice trade size and trading decisions (13,000 trading days) on these 985 different price series, that will make a difference.
From all the chaos of having 985 price series meandering almost randomly over a 50 year period, the above chart still managed to generate quite a smooth exponential looking curve. It also indirectly implied that one could “control” to a certain extent its long term objectives. You could increase or decrease the aggregate value of: g + T and thereby gain some control over its long term CAGR, and consequently its doubling time. Interesting prospects...
I had to provide that program with some steroids, just to see, and show one could “kind of” control this monster. Increasing the profitable trading activity T would generate more funds that could be reinvested in more shares. So, without much comments on the procedures used, here are the results for this, run once, 50 years test on steroids:
On the performance metrics I got:

The equity line gave:

And the inventory accumulation showed:

These 3 charts can easily be compared with the 3 charts in my previous post. Putting just a little bit more pressure on the system added some $2B to this long term trading scenario. And in the process improved on all its metrics. More returns from less risk. I requested more trading activity and the program complied. It generated 101,072 more trades; and still improved on its metrics.
Size:
Color:
Last week, I conducted a simulation study spanning 50 years using the DOW 30 stocks. The objective was to show how a trading strategy would behave over past trading intervals ranging from 1 year to 50 years in duration. I did tests over increasing periods, starting from 1 year ago to now and going back as far as 50 years using the following year sequence: 1, 2, 3, 5, 10, 15, 20, 25, 30, 35, 40, 45 and 50. This way one could see the progression over time of what was designed to be a long term trading strategy.

The above chart shows the results for each of the tested trading intervals. To read the chart, locate a column and read the generated profits. For example: if I started 20 years ago, what would have been the outcome? The answer can be read in the 20Y column. It gives the liquidating value or total accumulated profits over the last 20 years for each of the 30 DOW stocks plus 2 in the portfolio. The same goes for every other trading interval. The table above shows that had you started 2, 3, 5, 10, 15, 20, 25, 30, 35, 40, 45 or even 50 years ago, you would have won.
If you wanted to enhance performance further, modifying the program to accumulate more shares, meaning increasing the trading activity which would generate more profits which could be reinvested to acquire more shares. The output of such tests resulted in:

For a more detail presentation of the above tests, please review the following:
http://alphapowertrading.com/index.php/papers/171-winning-by-default-iiThe above link shows more details on the trading strategy and its enhanced performance levels, and this not just on a few trades but on most of them, even going back half a century.
Size:
Color:
Size:
Color:
abegy, yes. That trading method trades in clusters. Entries are spread out in time and at one point all shares will be sold resulting in a profit or a loss; and from there the process will start anew as shown in the last two charts. The strategy starts small meaning that position clusters start small; and clusters will grow as equity builds up over the whole trading interval (25 years).
Size:
Color:
Size:
Color:
Mitchell, I considered at one time making provisions for survivorship bias, but I had academic studies putting it at about 3% long term. So, I never bothered much about it.
Trying to take care of survivorship bias, I would also have to include the whole stock selection process in the equation and design more elaborate trading structures to phase out undesirables and acquired stocks to be replaced with other stocks. And then the whole stock selection process itself would be questioned. There is no easy answer to backtesting the effects of survivorship bias since you might introduce other biases by doing so.
I'm aware of the survivorship bias in the DOW 30 + 2 selected stocks, but it is not that important an issue. I was more looking at the long term behavior of trading strategies on a bunch of stocks with one big question: would the strategy survive over the long term (20+years)?
Nonetheless, I do understand your point. And I expect it will have a negative impact on performance. However, I would have to study, on a trading script basis, what would be the consequences of the various biases one can introduce in a trading strategy. Trading strategies would not be affected equally. The method of play would also have a major impact on analyzing these biases. But I'm not ready to do that now.
Size:
Color:
fwiw,
78% (111 out of 142) of the Nasdaq 100 stocks delisted since 1995 were acquired or merged with other companies, usually resulting in a significant premium in the stock price. Only 19 went Chapter 11 and another 6 of the 142 went private. (I haven't resolved the fate of the remaining 6.).
Anyway, I throw that out there because "survivorship bias" implies that the companies leaving the index have failed, but the statistics indicate the opposite is closer to the truth. Undoubtedly, testing using a dynamic watchlist will give you different results, but probably not a lot more different than substituting with other randomly-selected stocks during the test period.
Size:
Color:
Thanks for both of your comments. I wasn't really implying it was a huge negative effect. I've found the effect to be directly related to the type of strategy (i.e mean reverting strats tend to get hurt the most while some trend strategies can actually benefit). I'll code up the routine to quantify it for the dow when I get a chance (I've done it in another application, I just need to port it over).
Size:
Color:
If you have or can find data for "National Steel" (former Dow component from 11/20/1935 to 6/1/1959) but went bankrupt in 2002, please let me know.
Size:
Color:
In one of my last posts I said that my trading strategies were scalable. The examples presented were for scaling down. None for scaling up. See the one more thing section of the linked paper for an example. My latest strategies were back tested going back as far as 25 years.
It was mentioned, once or twice, that I would be giving my best trading strategies away. Well, this is just what I did. I offered them to the Bill & Melinda Gates Foundation. I found it to be the best outcome for my years of research.
I view this offering as my way to help people, more than I ever could alone. It is all explained in my latest paper: A Donor Within.
.
http://alphapowertrading.com/images/DEVX/ADonorWithin.pdfThe paper shows that it is by letting the Foundation's trust unit grow as much as it possibly can that the Foundation itself could do more. And that it might be in the pursuit of these portfolio management techniques that the Foundation could reach its goals.
The trading methods described in the paper could help anyone wishing to outperform over the long term. It covers trading strategies that have been presented here before. One of which was selected to do even better.
I think that any big portfolio could benefit from this trading methodology which simply says: accumulate shares for the long term and trade over the process. IMHO, there are many ways to do just that.
Size:
Color:
In my last post I made reference to my last paper: A Donor Within. It dealt with a stock trading strategy designed to perform over the long term (some 25+ years). This new one is related to it, it's kind of a follow on.
First, a little history.
The original version of the program was developed right here on Wealth-Lab and is referenced as: “XDev Long V1”, originally coded by fdpiech and later modified and republished by Gyro, July 5 2002.
In July 2011, I extensively modified this trading script to transform it to my liking. You will find it referenced in this thread. My modifications were tested on 2 different data sets of 43 stocks each over a 6 year period (1,500 trading days).
The strategy was again modified in June 2014, its name was changed to DEVX V3 because there was not much left of the original design. The program had grown from about 70 lines of code to about 1,200. Its trading philosophy totally changed. This November, even more trading routines were added to push the strategy to version 6 with some 1,460 lines to finally end up as DEVX V6 enhanced with 1,859 lines of code as used in my paper: A Donor Within and now in my latest one referenced below.
DEVX V6 enhanced, is a stock trading strategy designed to accumulate shares over the long term and trade over the accumulative process. It's primary mission is to build a long term portfolio. And it's singularity being that all trades are the result of random functions. It also shows why building a stock inventory over time has its own merits, and these merits can be viewed on the bottom line.
Since there are many graphics, and it's 18 pages long, please follow this LINK:
.
http://alphapowertrading.com/index.php/papers/174-devx-v6-revisitedI think that it could be of help in designing your own trading strategies. Hopefully, you will find some interesting ideas and new avenues to explore. Wealth-Lab has been highly instrumental in helping me design better trading scripts and I hope it will do the same for you.
Thank you for taking the time to read my research note.
Size:
Color:
Any stock trading strategy should be basic common sense. A stock portfolio does not grow instantaneously; it takes years to build it up and nurture. It is not enough to make a trade here in there without considering the size of the portfolio or the time span under which it will have to grow.
Making a 100% profit on a trade is good, but it simply might not be enough. If you risked 5% of your portfolio, it will grow by only 5%. If it took 2 weeks to make the 5%, great. If it took 2 years or more, positive, but not so great. An immediate question would be: what do you do after? Finding another 100% profitable trade! Well, those don't come by on a weekly basis... and even if some do, there might not be that many or even be predictable in some way.
If, for example, I play AXP, at whatever time frame, I will be faced with the same time series as everybody else. And with its 1B shares outstanding, I won't be the one moving the price either. This AXP time series can be expressed as: p(t) = p(0) + Ʃ Δp (an initial starting price plus the sum of all price variations thereafter). My AXP interest, as in any other selectable stock, is in the positions I might, could or can take. But overall, only the taken positions will impact the portfolio. The could have, should have, or would have don't generate profits. Only the have, did, done and executed matter.
I could cut p(t) into thousands of pieces, or in as many irregular time intervals as I want, each with its own entry p(in) and exit p(out) to define each trade. A profit or loss on a single trade is given by the quantity held over the time interval: q*Δp = q*(p(out) – p(in)). To handle thousands of trades I can number them sequentially: q(i)*Δp(i) = q(i)*(p(out)(i) – p(in)(i)) which can show the profit or loss in the ith trade among many (i = 1, …, n).
Profits and losses for all n trades would sum to: Ʃ(n) q(i)*Δp(i) = Ʃ(n) q(i)*(p(out)(i) – p(in)(i)). Technically, ending up with n price segments Δp(i) with inventory q(i). All price segments with no inventory (q=0), meaning no participation, just as a Δp(i) = 0 would have no trading value and therefore could not increase or decrease a portfolio's value.
To outperform a Buy & Hold, I need: Ʃ(n) q(i)*Δp(i) > q(0)*(p(T) – p(0)), meaning that the sum of all price segments with inventory should be greater than the entire price series. If n is too small and/or the Δp(i)s are too small, then the sum of price variations might not be sufficient to outperform even a Buy & Hold. Making 50 trades with an average profit of $1.00 per share will have the same impact as having 1 trade with a profit of $50.00 over the same time span. However, making 100 $1.00 trades would exceed the 1 trade $50.00 profit.
Trading has constraints, one of which would be to at least take a sufficient number of price segments (trades) to exceed the price differential of the entire period of play. Meaning you should aim to at least beat the Buy & Hold over the long haul, otherwise, what's the use of trading?
Another constraint is slicing the time series: Δp(i)?, which translates to: delta p what? What is the outcome of the ith future price interval? There is no way of knowing this, especially if I plan to do thousands of these trades in the future. The mathematical formula will account for the total generated profit or loss from the n trades: Ʃ(n) q(i)*Δp(i); this irrespective that I look at the past or the future. But it still won't help in predicting any of the n trades nor their price differential Δp(i) going forward. Neither will I be able to determine q(i) unless it is fixed like using a constant or subject to a predefined function. Having a fluctuating stock inventory can have its benefits...
In payoff matrix notation, all the above translates to: Σ(H.*ΔP), all of it resumed in one expression. Most people start by designing a trading strategy from whatever concept they might have while I start by the background math and then figure out how I could take advantage of what I see. It gives a slightly different perspective to the portfolio management problem.
Size:
Color:
As a follow up on my previous post.
The evolution of a portfolio is determined by its ongoing inventory composition. It can be written as a time function:
A(t) = A(0)*f(n, q, Δp, I, D, t).
The information set (I) can be independent of everything. It's just one's way of looking at things and reaching trading decisions or not (D).
Some basic trading styles can be explained using A(0)*f(n, q, Δp, I, D, t). For instance the Buy & Holder, as a long term player, will have fixed q looking for the large Δp that will develop over long holding intervals while keeping n relatively small. Mr. Buffett's trading style fits in this category. It is as if he went for large Δp, large q with n not so big. He solved his optimization allocation problem by growing n, q, and Δp over time which enabled him to exceed long term market averages.
In his dealings, he gradually went for the larger q (elephants) coupled with large Δp. It has proven to be most effective. But it's not everyone that can go elephant hunting, even Mr. Buffett started with smaller game. It is just that with time, that is where traders/investors need to end up. It is not how they can start, but it is what they should aspire to. You can't nickle and dime the market or flip your entire portfolio on a weekly or daily basis. Your trading strategy has to evolve and be conscious of the law of diminishing returns as the portfolio grows.
At the other end of the time spectrum you have HFT. It relies on large n, small q and small Δp. It's not that they would not like large Δp, it's just that they are not necessarily available under their short trade time horizon. So to compensate, they go for high frequency, really high frequency. A million $1,00 profit is still a million dollars, and HFT firms understand this quite well. There is no elephant hunting here, just grazing on their small change diet without bothering the elephants or even letting them know.
Traders are all shades of in between mostly limited by A(0), their initial capital. They can't do HFT, resources being too limiting. Nor can they afford elephants. So they jump with both feet on the Goldilocks Δp of their choice using whatever kind of “predictive” future they can find. Their hope is that based on their unique information set they can make favorable, meaning on average profitable trading decisions. However, some might not have fully grasped the word “coincidental”.
Most short term traders go for Ʃ(n) q(i)*Δp(i), and kind of forget that n and t also matters. They design trading strategies capable of generating a positive average Δp producing a positive outcome: Σ(H.*ΔP) > 0. And because of their size are forced to have relatively low q(i) which will let their portfolio grow but not at high speed. Δp's take time to develop. And since their strategies were not designed to generate large n either, they are limiting their potential.
Their strategies often seem to break down with time, or need optimization all the time to compensate debilitating deficiencies, when the designer could have easily remedied the problem in his/her code. If they don't initially address the problem in their code, how could it ever be solved?
This kind of changes the nature of the game. Instead of trying to find trading strategies by mimicking past observations, anomalies or price patterns and applying those to future price movements; one could look at ways to increase n, the number of trades, increase q(i), the quantity traded as profits increases and also try to increase Δp(i) even with its limited range in price movements due to its limited trade time. It becomes a bean counting proposition, akin to finding a mathematical solution to: how many trades with such and such characteristics will I be able to extract from future price movements over the long haul?
My research resumes this in matrix notation to: Σ(H(1+g)^t.*ΔP). It says: increase the holding inventory at an exponential rate in order to compensate for return degradation and accelerate performance. This can be done by increasing n, q(i), and Δp(i) as the portfolio grows.
Size:
Color:
Over the last few days, I needed a trend definition indicator and remembered that Glitch had done one which he called at the time (late 2000) Wealth-Lab Trend Index. It was the result of multiplying the rate of change of 3 EMAs of different lookback periods. He also suggested a method on how to use it.
This indicator acts like an MACD but would have the advantage giving both direction and intensity. So it was an easy pick.
For the program I needed to develop, I used as base the textbook example of the MACD found in the WL user manual. Ok, I'm lazy, I know!
Then the task was to improve on this strategy design, make it do what I wanted. First, the Trend Index help divide price movement in 3 regions. I was to use the same description as Glitch had documented in his non-trading script, that is define above +100 as a selling zone, below -100 as a buying zone, and the in between as a hold or waiting zone.
A typical chart would look like this:
.#1 Chart from Original Code

where it can be seen that the blue and red bars appear at extremes. The next function was to add trading procedures. Having chosen the MACD textbook template, all I need was to modify it to do whatever.
For those that have followed some of my stuff. My primary interest is for long term trading systems, meaning 20+ years. If a strategy can't show it can survive that long, I lose interest. My trading strategies can be resumed in one sentence: accumulate shares for the long term and trade over the process. And that is what I intended to do with this collection of code snippets.
So, I started with the no frill version which produce the following as output:
.#2 MACD Chart

Sorry Glitch, I recolored the bars (cosmetics): green for ascending and red for descending while WLTI > 100, and yellow for descending, blue for ascending while WLTI < -100. From the output shown, performance wise, not that great. In fact, I would discourage anyone from using that script if left as is.
But, wait, there is more. I modified the script to allow stock accumulation which produce what follows:
.#3 Trading MACD Chart

That's a 53-fold improvement over chart #2.
With more improvements like controlling the exits, and increasing the number of trades, under the constraint that there be available reserves to do so, and using leverage at times, resulted in the following chart which is more desirable.
.#4 MACD v02 Multiple Entries & Exits

Now, we're talking.
By changing the nature of the MACD trading structure and using Glitch's WLTI as trend definition you start to achieve what I would call interesting long term results. What do you think?
Glitch, thanks.
Size:
Color:
This is from a ticket:
QUOTE:
So all my research and simulation testing since 2004, after my trial version, has been on the old Wealth-Lab 4 legacy site.
Still it's very encouraging to see how the "wl4 legacy website" still works for you despite having been depreciated for everyone else.
By the way if someone offered me a free license of some product and I would stop using it and went back to using a cracked copy of its legacy version, I would at least keep low profile.
Size:
Color:
Hi Eugene,
Hard to believe, but when that was said, it was true.
Let it be said: WL4 is a dead and permanently extinct computer programming language.
Anybody still having a copy will eventually throw it in the garbage when they will find no further use of it, even if they paid for it. BTW, to anyone out there, I'm a buyer if you still have a working copy. But note that your copy will need to be unlocked, “cracked”, so it can work on my current, next, or next machine.
Technically, it seems like I don't have a choice, I get an unlocked copy or use the latest version. But, I already have that. Yet, I still need and currently prefer to use the old and more limited version. There are many reasons for this.
Eugene, if you wish, you could delete this whole thread, change my password if you like. I certainly would get the message. I know I've stuck around the forum for more than awhile. Who could be offended by some code? Maybe you find offensive the things I write?
But this would not stop me from using an “unlocked” version of WL4. I might be more private, design or paint more generic charts, and remove the Wealth-Lab logo on anything that I would make public. But I won't do that.
I consider anytime I put a WL chart in public view is like me endorsing your program, like wearing a Wealth-Lab t-shirt. Something like: it seems good enough for him, it might be good enough for me. You will have noticed I always leave the Wealth-Lab logo in plain view on all the charts produced on the onsite simulator or otherwise.
Now, here is why I continue to use the old WL4 program even in its current state. Over the years I've accumulated an extensive library of trading strategies and code snippets that only work on WL4. Thousands of hours invested in a specialized extinct computer language!
I need to keep the ability to easily access, read and process these trading scripts. A lot of my time has been invested in designing them. Strategies that I could run on the old WL4 onsite simulator from 2004 to 2013, but no more. I needed to preserve my work.
In our digital age, the nature of storing archives has changed, but the reason why we keep them has not. Our computers have become our filing cabinets which are moving from our machines to the cloud.
As long as there is a file reader for the stored file, whatever file format it may be, I feel I'm ok. That it be pictures, music or text. But when it comes to program code, which by the way I also keep in text files, storing it is not enough. A 2,000 line of WL4 code is not something you read, it is something you execute to see what it does, otherwise it becomes total garbage, useless and irrelevant.
Therefore, as long as I will wish to keep, read or use the body of work I've done using WL4, I intend to keep the “unlocked” version of WL4. It is not a question of low profile. It is more a neglected area of software developers misunderstanding that their software products can at times have a longer life and that their legacy users might still want or need to read their files.
I do have a solution.
Why not sell me an old WL4 program permanently unlocked, with all its “features”, in used or quasi-mint condition? I don't need support. And to top it off, you are almost assured that with time, I will simply fade away. I would be left with a program that has no trading or broker connectivity. No salable trading scripts, since no one would be able to execute them on their machines without a working version of WL4.
I have a legit copy of WL6.6, thanks to Robert, and a dead legacy “unlocked” partial WL4. What's the difference if I use either one? If I had been able to buy WL4, would I still be using it? Most probably yes for a number of reasons.
After my trial version in 2004 which by the way lasted about 3 months because in those days I kept the program opened nonstop. It took a power failure to break the cycle. After which, the trial version being over, it would not run anymore. But it was sufficient time to learn enough of the program to get hooked.
And there I was, stranded after having spent 3 months of “my” time learning a programming language that I could not use. A total waste.
You see, in those days, Wealth-Lab did not sell to people in Québec. I could not even buy the program. I tried to purchase a copy, but to no avail.
I turned to the more limited online website simulator version where I spent countless hours learning more and more of the software's capabilities. Since I was able to do what I wanted, I kept doing more and more.
So, yes, from 2004, after the trial, all my strategies were run on the WL4 site simulator, all of them, up to mid-2013. I would program in NoteTab and could issue a ctrl-a ctrl-c ctrl-a ctrl-v sequence in a fraction of a second on a double screen system, press execute and get some of the answers I wanted. Then I would send a ctrl-a ctrl-x to save the program online with only its title, hopefully leaving no trace of my passage except for a token character or two for file size.
I was limited in what I could do as you are well aware, but I've always appreciated the fact I could at least do that. Plus some of the forum members had interesting things to say. I've participated in the forums since 2004 and have chronicled my own research live in this very thread since 2008. You will find the very first post in this thread giving my intentions and it is still true today. Ah, those crazy Québécois!
In 2008 or close, WL switched language (WL5), then Fidelity bought the company (WLP, also not available in Québec), then support for WL4 was abandoned, and then WL4 was shut down leaving legacy users up to dry.
I consider myself part of the legacy users (some 12 years), even after having never bought a single copy of the WL program.
Based on my records, I've used the old WL4 site simulator up to the summer of 2013. It is only after, that you can find some of my articles or posts having charts with more than 1,500 bars, a telltale sign of using an unlocked copy if not registered in your database.
Anything before that was in fact executed on the WL4 site simulator. You can check, it is easy to spot. Even Robert made that observation as soon as I posted a 10 or 20-year chart.
In the summer of 2014, Robert, as you know, graciously offered a free copy of Wealth-Lab 6.6. I did hesitate before taking it since I was not sure I might even use it, and this was expressed to Robert. The transitioning from one computer language to another meant another learning curve. In learning any computer language, you have to put in months to use them efficiently.
I see the cost of the WL software program as trivial, it is what comes after that is expensive.
For the things I wanted to do, which was design trading strategies as some kind of complex puzzle or mind game, the old WL4 did the job. It can take me months to design a new strategy or it can take only a few days as the last one presented. So, I am not an extensive user, more a dabbler. I have an idea, I program it, and see what it does. Most often it stops right there, in want of a better idea.
When the old WL4 site was shut down, I went out to find someone with a legit copy to sell. Couldn't find one. So I settled with a cracked copy that has some problems, but since I don't use those “features”, I don't mind so much. I never hid the fact that since 2013 I used an unlock copy of the program.
I've expressed many times in the past that WL was able to grow because of all the nerds, crackpots, and early adopters. The legacy users that made up its online community where at times people posted their ideas, strategies, and engaged in lively discussions. I know I've participated in a few. That is what made WL great, its people. A community helping one another. I admit, I miss many of them, some were brilliant.
We certainly look at things differently. I would have seen the previous post as a wow moment, like incredible, someone, in 2016, is still using that old defunct software and doing cool stuff with it, impressive.
I am fluent in a totally dead language that nobody else will ever speak. Now, that is trivia. Maybe the last of a kind.
In all this I see no evidence of lost or damage to WL in anything I do using the old WL4. You put it out, and in route, changed its language, its future, and technically killed it. With only a minor consideration to your old supporters and legacy users. If anyone still wanted to use WL1, 2, 3 or any other version, it should be their choice, not mine, and maybe not yours.
Nonetheless, I do like some of the features in WL 6.6 even if I don't presently have a use for them. But it might come some day, and then, maybe, the latest WL release will be available in Québec, who knows!
With due respect.
Size:
Color: