In the Execute section I have 2 TimeSeries that collect data bar by bar and then at the end I request to plot the data. See code
For simplicity I have all the data set to + and -3. Now take a look at the screen shot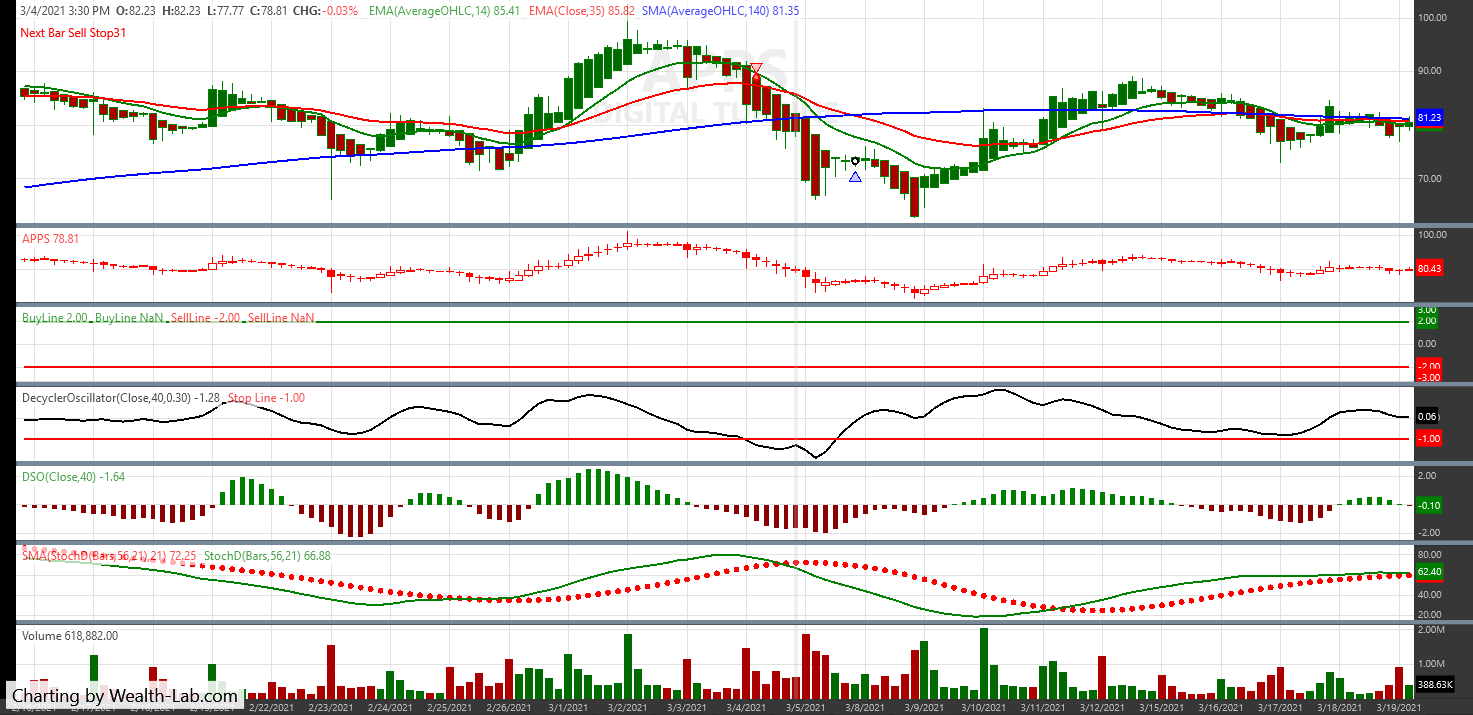 There is a plot section with no plot, this is where I should show a straight line of + and -3.
It seems that the plot commands are sending a bunch of zeros, and then a speck of + and - 3. I say that because if I plot from the Initialize section they show the top and bottom line next to the plot boundary when the lines are + and - 2. I hope that makes sense.
CODE:
if(bar == barCount -1) //plot only when all the data is in
         {
            PlotTimeSeries(BuyDisp, "BuyLine", "BuySellpane", Color.Green, PlotStyles.Line);
            PlotTimeSeries(SellDisp, "SellLine", "BuySellpane", Color.Red, PlotStyles.Line);
         }
For simplicity I have all the data set to + and -3. Now take a look at the screen shot
There is a plot section with no plot, this is where I should show a straight line of + and -3.It seems that the plot commands are sending a bunch of zeros, and then a speck of + and - 3. I say that because if I plot from the Initialize section they show the top and bottom line next to the plot boundary when the lines are + and - 2. I hope that makes sense.
Rename
The problem is happening in the code you're not showing us, the code that assigns values to the TimeSeries that you are plotting. Without seeing that we can't really help.
One tip, you can plot the TimeSeries in the Initialize method, after you create the instances. You don't need to do it in Execute after that if statement. Functionally it's the same but it will make your code a bit cleaner.
The reason it works like that is because, even though you are calling plot in Initialize, it's not really processing this plotting code until everything is done running and it's time to update the chart. By that time, the TimeSeries has all of your values that you added in the Execute method.
if you want to keep things more private, just email the strategy to support@wealth-lab.com.
Glitch,
In the Initialize and Execute sections I use
What seems to be coming back to plot is almost all zeros.
To plot I use
Thank you
In the Initialize and Execute sections I use
QUOTE:
TimeSeries BuyDisp = new TimeSeries(bars.DateTimes);
TimeSeries SellDisp = new TimeSeries(bars.DateTimes);
What seems to be coming back to plot is almost all zeros.
To plot I use
CODE:
PlotTimeSeries(BuyDisp, "BuyLine", "BuySellpane", Color.Green, PlotStyles.Line);
         PlotTimeSeries(SellDisp, "SellLine", "BuySellpane", Color.Red, PlotStyles.Line);
Thank you
Ok you are creating the TimeSeries. But you still have not shared the code that shows how you are assigning values to them. Please share the full code.
You also say you create them in the Initialize AND Execute methods? You need only do that in Initialize.
You also say you create them in the Initialize AND Execute methods? You need only do that in Initialize.
Your Response
Post
Edit Post
Login is required