PlotStopsAndLimits is supposed to plot:
1) Dots... instead, its plotting a line
2) For the duration of the trade only... instead, the plotted line runs the entire length of the chart.
Plz fix.
1) Dots... instead, its plotting a line
2) For the duration of the trade only... instead, the plotted line runs the entire length of the chart.
Plz fix.
Rename
1) Plots dots as expected.
2) For the duration of the trade only.
How to reproduce?
2) For the duration of the trade only.
How to reproduce?
I believe you're confusing the lines that WL7 draws for limit and stop order Signals with the Plotted Stops.
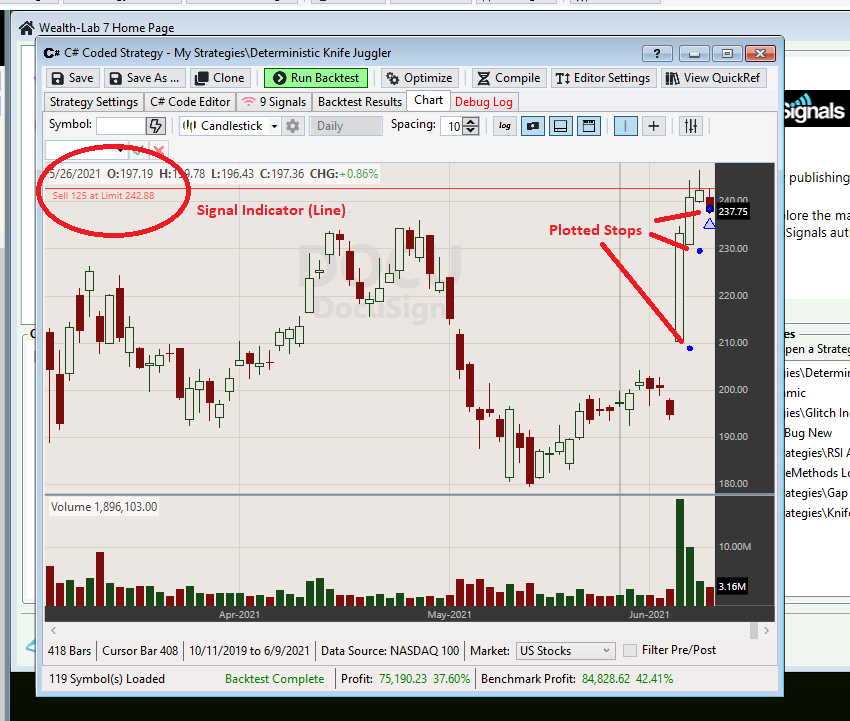
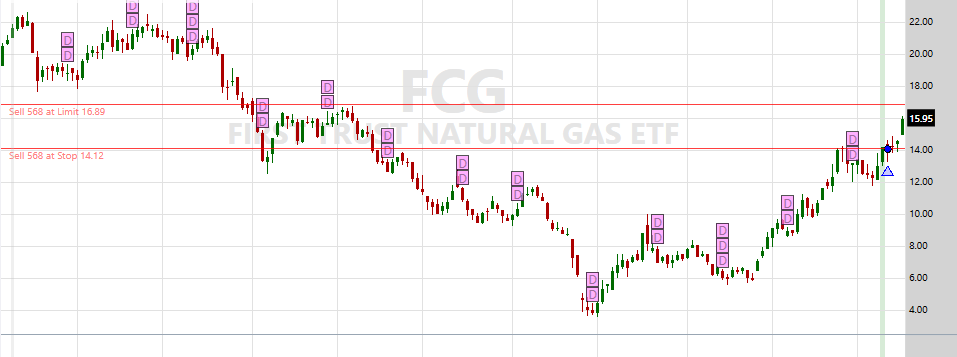
I don't see any dots, just lines.
Note that the scale is Weekly, could that have anything to do with this?
No. Have you defined any exits with OrderType.Limit and OrderType.Stop for the method to plot something?
Here's a minimal Strategy, can you run this on weekly data and report back? If you're still having trouble, please share some minimal Strategy code that reproduces the issue.
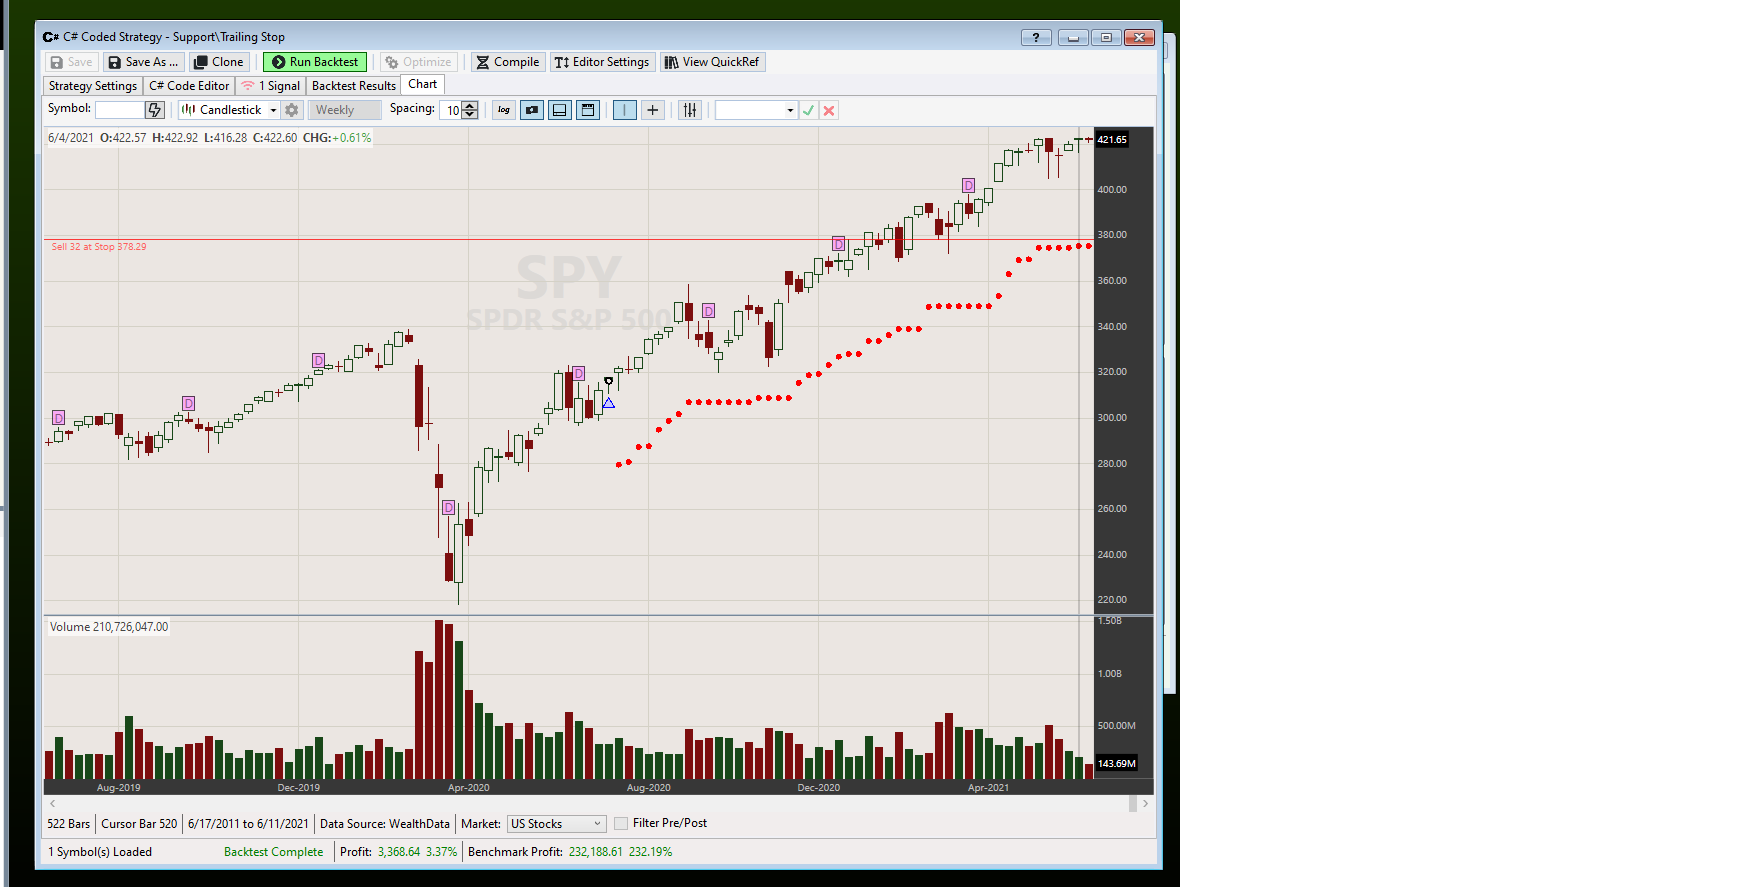
CODE:

using WealthLab.Backtest;
using WealthLab.Core;

namespace WealthScript1
{
    public class MyStrategy : UserStrategyBase
    {
        //Initialize
        public override void Initialize(BarHistory bars)
        {
         PlotStopsAndLimits();
        }

        //Execute
        public override void Execute(BarHistory bars, int idx)
        {
         if (idx == bars.Count - 50)
            PlaceTrade(bars, TransactionType.Buy, OrderType.Market);
           else if (LastOpenPosition != null)
         {
            double stop = bars.Low[idx] * 0.9;
            if (stop > stopLevel)
               stopLevel = stop;
            PlaceTrade(bars, TransactionType.Sell, OrderType.Stop, stopLevel);
         }
        }

      //private members
      private double stopLevel = 0.0;
    }
}
@Glitch:
Tested your code, got same result as shown in your pic.
Q1: Is there a way to just plot the Stops but *not* the line?
@Eugene,
Yes, OrderType.Stop and OrderType.Limit are both defined (that's how I get those lines).
However, instead of using PlaceTrade... as in Glitch's code I'm using ClosePosition...
sooo, when I modify Glitch's to:
it just plots a line, no dots.
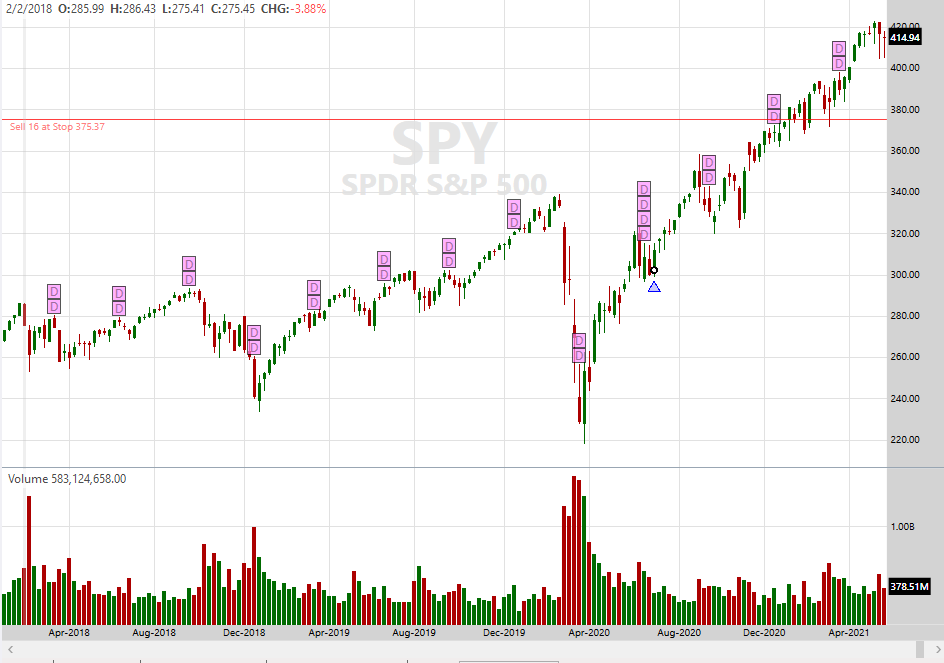
So there's the culprit...ClosePosition vs PlaceTrade. To me they're equivalent.
Q2) Is there a way to have Plots work in the desired manner with ClosePosition argument also? (it worked that way in WL6).
Tested your code, got same result as shown in your pic.
Q1: Is there a way to just plot the Stops but *not* the line?
@Eugene,
Yes, OrderType.Stop and OrderType.Limit are both defined (that's how I get those lines).
However, instead of using PlaceTrade... as in Glitch's code I'm using ClosePosition...
sooo, when I modify Glitch's to:
CODE:
            //PlaceTrade(bars, TransactionType.Sell, OrderType.Stop, stopLevel);
            ClosePosition(LastPosition, OrderType.Stop, stopLevel);
it just plots a line, no dots.
So there's the culprit...ClosePosition vs PlaceTrade. To me they're equivalent.
Q2) Is there a way to have Plots work in the desired manner with ClosePosition argument also? (it worked that way in WL6).
Yes, we need to get ClosePosition to plot the dots too! Glad we isolated this!
Good!
Re: The plotted lines...
Is there a way to disable them? I don't see such an option under Preferences.
Re: The plotted lines...
Is there a way to disable them? I don't see such an option under Preferences.
It's now plotting for ClosePosition in Build 11.
No, there's currently no way to disable the signal lines.
QUOTE:
...currently no way...
Hopefully, some day...
Ciao!
You can submit a #FeatureRequest, I'll vote for it - it would be a pretty quick enhancement :)
Done!
Your Response
Post
Edit Post
Login is required