The indicator value is getting overlaid by other items, here are 2 examples:
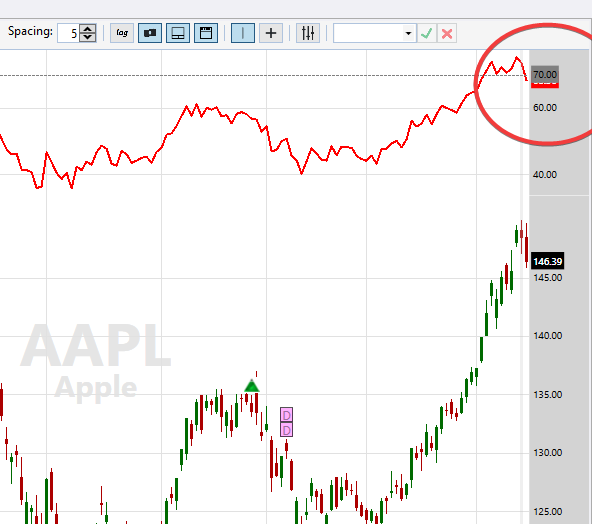
1) DrawHorzLine (to mark overbought value in an RSI indicator pane) overlaps the indicator value making the latter impossible to read:
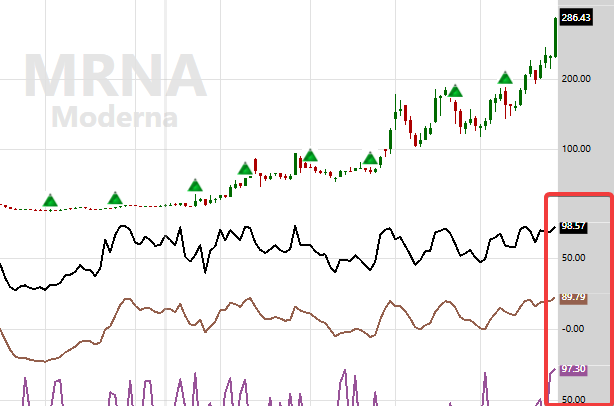
2) Hidden pane separator lines overlie the values of indicators when they're near top of scale making them hard to decipher:
It would be nice if the indicator values are plotted in front of such items; the indicator is, after all, the 'star' of the show. This can be done via a boolean plotting option or as a default methodology.
[BTW, I'm loving the code-based hide pane lines option introduced in the latest build 14 !]
1) DrawHorzLine (to mark overbought value in an RSI indicator pane) overlaps the indicator value making the latter impossible to read:
2) Hidden pane separator lines overlie the values of indicators when they're near top of scale making them hard to decipher:
It would be nice if the indicator values are plotted in front of such items; the indicator is, after all, the 'star' of the show. This can be done via a boolean plotting option or as a default methodology.
[BTW, I'm loving the code-based hide pane lines option introduced in the latest build 14 !]
Rename
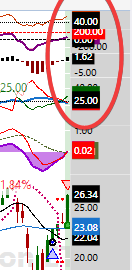
It really affects productivity if one is constantly hovering the mouse over an indicator to know its value as its been overlapped by, for example, DrawHorzLine:
WL7
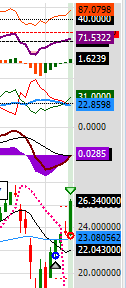
By contrast, in WL6 DrawHorzLine automatically gets plotted in the background and the hidden pane lines are truly hidden and don't overlap indicator values in the right axis and things are so much clearer:
WL6
===============
1) I urge the developers to have DrawHorzLine automatically be in the background. -OR- see #2 below.
2) In case of a multi-plot (MACD w/Signal line & Histogram, ADX w/DI+ & DI-, an oscillator w/oversold & overbought levels, multiple indicators in 1 pane, etc.) the forefront order should be dictated by the order plotted so that the one plotted last overlays the previous ones. This way the user can create their own order.
WL7
By contrast, in WL6 DrawHorzLine automatically gets plotted in the background and the hidden pane lines are truly hidden and don't overlap indicator values in the right axis and things are so much clearer:
WL6
===============
1) I urge the developers to have DrawHorzLine automatically be in the background. -OR- see #2 below.
2) In case of a multi-plot (MACD w/Signal line & Histogram, ADX w/DI+ & DI-, an oscillator w/oversold & overbought levels, multiple indicators in 1 pane, etc.) the forefront order should be dictated by the order plotted so that the one plotted last overlays the previous ones. This way the user can create their own order.
Your Response
Post
Edit Post
Login is required