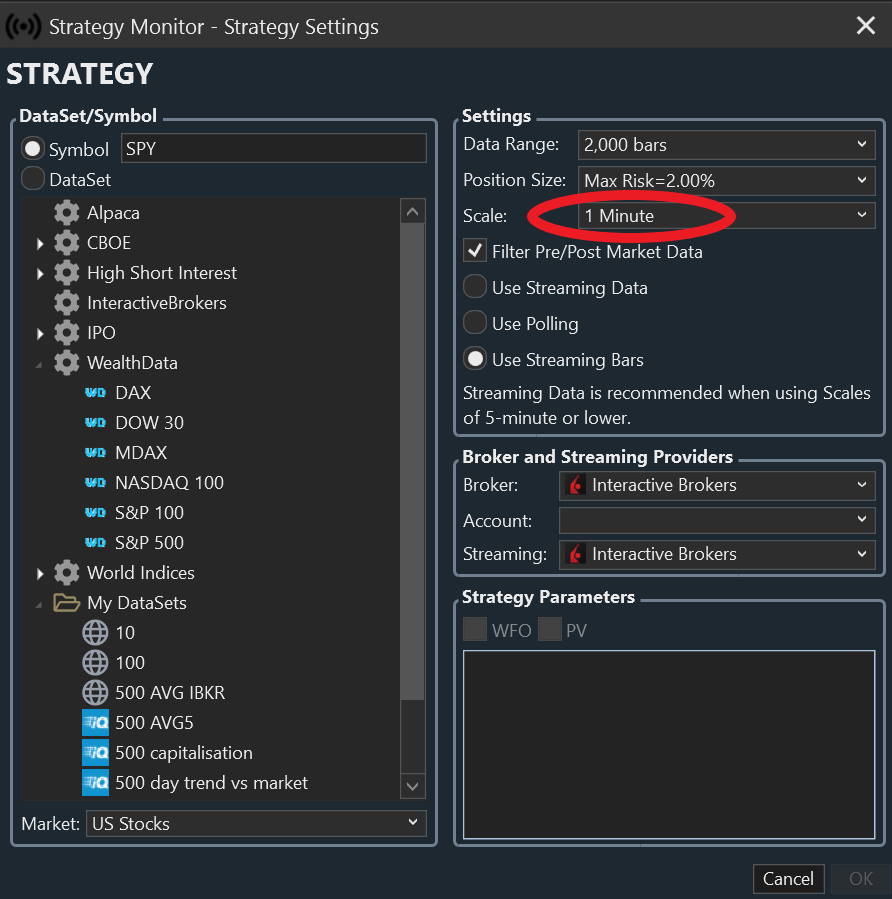
In Advance Settings If I do dayTrading in One Minute chart which setting should I use for a trade to be placed "On each tick" rather than at the next bar? So if my one minute bar crosses a SMA for instance I don't want to wait for the end of bar rather the entry to be placed as it crosses the SMA. (See image below) Thanks.
Rename
You’d need to (in a coded strategy) calculate the price at which the moving averages would cross, and then issue buy at stop order for the next bar. WL8 only issues orders for the next bar, not by tick.
Of course the SMA value that you pointed to is based on the Close of that bar. So the value is changing with every tick. and don't know where that point is during the bar's construction.
It does no update on each tick Even if you have a tick data provider? I have IqFeed.
The point is, during a single bar the price might move up, triggering the SMA crossover ON THAT TICK, but it then might just turn around and move down again, and by the CLOSE OF THE BAR you're left WITHOUT an SMA crossover, but WITH an open position in your account.
So, the only way to properly backtest something like this, and to trade it live in WL, is to use the calculation method I mentioned earlier.
So, the only way to properly backtest something like this, and to trade it live in WL, is to use the calculation method I mentioned earlier.
I realize the risk. But that is true in any lower time denomination bars like one minute compared to 10 min or 30 min bars. Do you have a sample of the Calculation method.
One way to get around it is using seconds bars so you get the next degree of granularity. Thank you
One way to get around it is using seconds bars so you get the next degree of granularity. Thank you
QUOTE:
You’d need to (in a coded strategy) calculate the price at which the moving averages would cross, and then issue buy at stop order for the next bar.
We've got indicators in the TASC library to calculate the price of a SMA/EMA and even BB and RSI at the given threshold on the next bar:
RevEngBBandCross
RevEngMACD
RevEngMACDSignal
RevEngRSI
RevEngSMATC (Reverse Engineered SMA's Tomorrow Close)
RevEngEMA
You guys are giving ideas for 2 indicators crossing when the question is where the price crosses 1 moving average in the future. It can't be done, but if you want to try, just take your best guess where that average will be - because it won't be there anyway unless you guess the exact price.
However, there's one way you could come very close - instead of creating an average of the Close (or High or Low), use the Open. e.g., SMA.Series(bars.Open, 20). Then, at the end of the previous bar, you can estimate where the open will be on the next bar using the Close of the current bar. Long story short, you're still trading with the Close of the previous bar, but at least your backtest could come very close to what happens in live trading.
However, there's one way you could come very close - instead of creating an average of the Close (or High or Low), use the Open. e.g., SMA.Series(bars.Open, 20). Then, at the end of the previous bar, you can estimate where the open will be on the next bar using the Close of the current bar. Long story short, you're still trading with the Close of the previous bar, but at least your backtest could come very close to what happens in live trading.
Or course it can be done. To be clear, we want to calculate the price at which point a crossover will occur on the following bar. Like Eugene said we have several of these reverse engineered indicators in TASC but not one that just does a smoother crossover.
The RevEngSMATC is the one you're looking for (TC = Tomorrow's Close). But you're still ignoring that we're not using 2 indicators.
The plot above has 2 indicators, but the question is about price crossing only one of them.
But I'll pipe down and applaud when the solution appears...
----
Re: The RevEngSMATC is the one you're looking for
I'll take that back. In reality, RevEngSMATC is only to be used to indicate if a crossover of 2 SMAs will occur on the next bar, which it predicts correctly a high percentage of the time. If RevEngSMATC crosses below the Close, then the fast MA will usually cross below the slow MA on the next bar, and vice-versa.
In other words, it doesn't actually give you the price of a crossing.
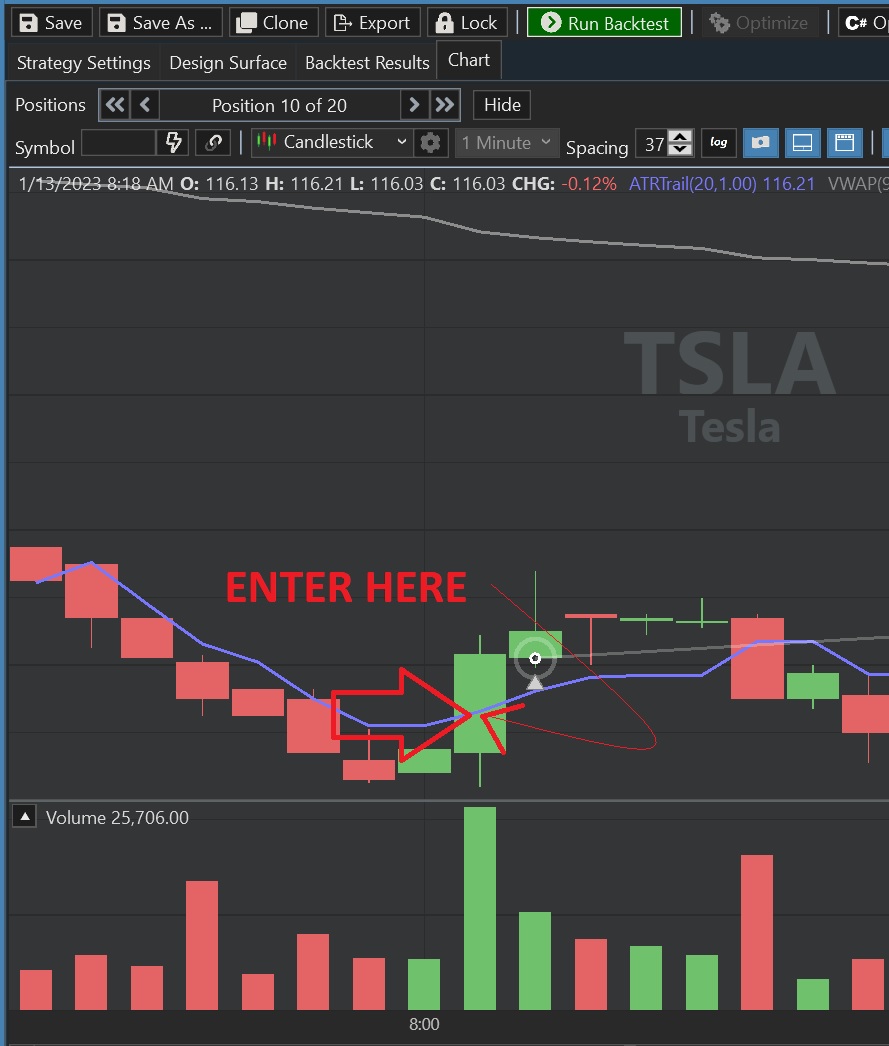
Look at the picture with the big red ENTER HERE. The entry point is where the 2 MAs cross, not price.
The RevEngSMATC is irrelevant here, we’d need a new indicator that reverse engineers an MA cross, I’ll work on one.
The RevEngSMATC is irrelevant here, we’d need a new indicator that reverse engineers an MA cross, I’ll work on one.
Thanks for the replies. To be clear this is the definition of what I was looking for:
Using Intrabar Order Generation in Backtesting and
Look-Inside-Bar Back-Testing
Shows the status of the Look-Inside-Bar Back-Testing feature that uses a specified intra-bar interval to identify price action occurring within each charted strategy bar. This helps to increase the accuracy of testing limit and stop orders within a strategy.
Both the indicator and price need to be updated on each tick based on tick data supplied by the data vendor.
I do not see 2 moving averages crossing at ENTER HERE. Really you do?
I only see a green bar crossing over one line, which is the ATRTrail indicator, not a moving average.
I only see a green bar crossing over one line, which is the ATRTrail indicator, not a moving average.
We don't plan to ever offer a feature that will update every indicator for every tick for every bar being backtested. That would make backtests run for hours instead of seconds.
Instead, I proposed creating an indicator that would let you achieve exactly what you're trying to do by delivering the exact price that a limit order would not be placed.
If you're interested in this solution I can pursue, but if not, I'll dedicate my time to other matters.
Cone: no, you're right, I was reading the grey line as another moving average but it's actually a price cross. Either way, Close could be specified as one of the "indicators" in the proposed solution.
If you're using say SMA(20) then just use SMA(19) (i.e. SMA(period - 1)). Here's the math. Its early here, so maybe I'm being a chucklehead...
Let c0 through cn be the closing price at bar n.
Let SMA(x)[n] represent the simple moving average for period x at bar n.
Let x = 20. Solve for c20 because that would be the exact crossing point...
Sum(c0...c19) / 20 = SMA(20)[19]
(Sum(c1...c19) + c20) / 20 = c20
Sum(c1...c19) + c20 = 20 * c20
Sum(c1...c19) = 20 * c20 - c20 = 19 * c20
Sum(c1...c19) / 19 = c20
I take it back.. now I see the assumption you're making.
But there's still something wrong. The final result is:
Sum(c1..c19) / 19 = c20
That's obviously wrong (not always, but just most of the time).
But there's still something wrong. The final result is:
Sum(c1..c19) / 19 = c20
That's obviously wrong (not always, but just most of the time).
Ok, then let me express c20 as the crossing point, call it t20. My point is you're trying to find the crossing point...
Let c0 through cn be the closing price at bar n.
Let SMA(x)[n] represent the simple moving average for period x at bar n.
Let tn be the crossing point and bar n.
Sum(c0...c19) / 20 = SMA(20)[19]
(Sum(c1...c19) + t20) / 20 = t20
Sum(c1...c19) + t20 = 20 * t20
Sum(c1...c19) = 20 * t20 - t20 = 19 * t20
Sum(c1...c19) / 19 = t20
If the idea is to find a level where price will cross a N-bar moving average on the next bar in order to place a stop or limit order, then use the N-1-bar moving average actually turns out to be a decent estimate. It can't predict where the bar will close (the ATRTrail indicator depends heavily on the actual close), but if we could do that, we wouldn't be here.
You needn't predict where the bar will close, that's irrelevant.
As you watch the streaming chart in real time, tick by tick, you see the SMA and the streaming closing price change, and eventually cross over at some point.
We can calculate the price at which the crossover will occur WITHOUT knowing or needing to predict the closing price of the next bar.
As you watch the streaming chart in real time, tick by tick, you see the SMA and the streaming closing price change, and eventually cross over at some point.
We can calculate the price at which the crossover will occur WITHOUT knowing or needing to predict the closing price of the next bar.
It would not be possible to integrate tick by tick into the backtest because it would be too cumbersome?
And what about the integration of ticks on Strategy Monitor?
And what about the integration of ticks on Strategy Monitor?
What is your goal here?
the integration of the tick on the time scale.
have a strategy based on a predefined number of tick.
have a strategy based on a predefined number of tick.
This is somewhat off the original topic, but tick scales aren't compatible with the way the Strategy Monitor schedules runs, so that's not going to happen.
Instead, you can trade your tick scales with Streaming charts... I'll wish you luck with that because WealthLab currently runs strategies over all the history in the chart, which grows with every tick bar. If you have many [tick]bars and a strategy that creates a lot of trades, you'll very quickly get into an overrun situation - the system may not be able to keep up with that in real time.
There may be a feature request to change the way WealthLab executes in real time, remembering the result of the previous run and only calculating the new bar. If I can find it, I'll add the link here. Even so, that would likely be in the distant future.
Concerning ticks, I therefore deduce that we can only use ticks on a chart. Tell me if I'm wrong.
So we can never integrate the tick into WL on other tools or extensions? (streaming monitor, building block strategy, genetic evolver...)
Out of curiosity, what prevents this?
So we can never integrate the tick into WL on other tools or extensions? (streaming monitor, building block strategy, genetic evolver...)
Out of curiosity, what prevents this?
QUOTE:
Out of curiosity, what prevents this?
Like Cone just said above, tick scales aren't compatible with the way the Strategy Monitor schedules runs.
You can use ticks for backtesting and for a Streaming Chart/Strategy.
You can even do it in the Strategy Evolver.
It's not going to happen for the Strategy Monitor.
Generally, it's currently impractical to trade using "ticks". I already explained why in the last post.
If you do try it, I'd caution you to concentrate on one symbol and use X-Second bars or Y-ticks, where Y is a number such that Y-ticks don't frequently happen within 1 second.
Your Response
Post
Edit Post
Login is required