Olá, estou com difilculdade para criar um arquivo para colocar um novo dataset no wealth lab 8. Qual é o processo e como deve ser esse arquivo?
Rename
Hi,
So that you're understood by English speakers you can use Google Translate:
https://translate.google.com
Be specific please. Are you talking about ASCII data? How does it look like (paste a couple dozen lines in the beginning). If not what data is this?
So that you're understood by English speakers you can use Google Translate:
https://translate.google.com
Be specific please. Are you talking about ASCII data? How does it look like (paste a couple dozen lines in the beginning). If not what data is this?
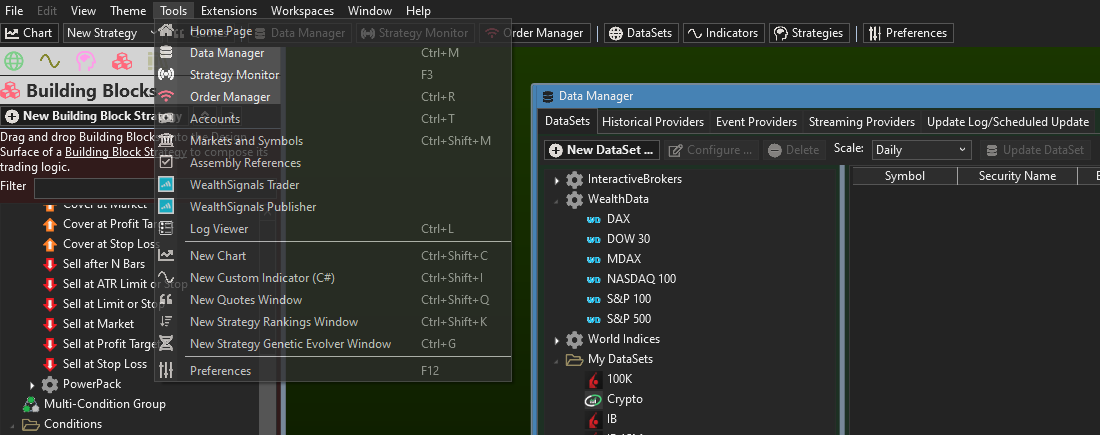
There several ways to do that. Here is one way.
Open the data manager. From there you can use the context menu or the button you see in the data manager for example.
Now create a new name. When you are follow the steps you need to input symbol names you like to have in your dataset.
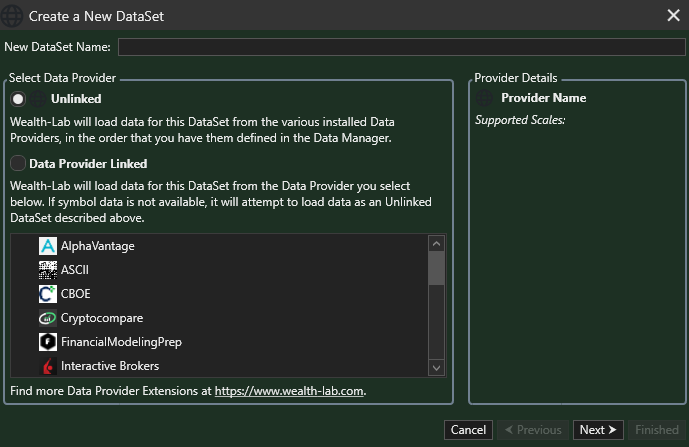
That's it. You can access the dataset in your list now.
Now, which symbols you want, or if you link them to a provider of your choice, is up to you. Data updates can be performed on a dataset but you can update the data more general in the tabs of the data manager. Just have a look.
This is a very general advice, if you are looking for more specific introduction there is more information needed, like Eugene already mentioned.
Open the data manager. From there you can use the context menu or the button you see in the data manager for example.
Now create a new name. When you are follow the steps you need to input symbol names you like to have in your dataset.
That's it. You can access the dataset in your list now.
Now, which symbols you want, or if you link them to a provider of your choice, is up to you. Data updates can be performed on a dataset but you can update the data more general in the tabs of the data manager. Just have a look.
This is a very general advice, if you are looking for more specific introduction there is more information needed, like Eugene already mentioned.
Very well said!!
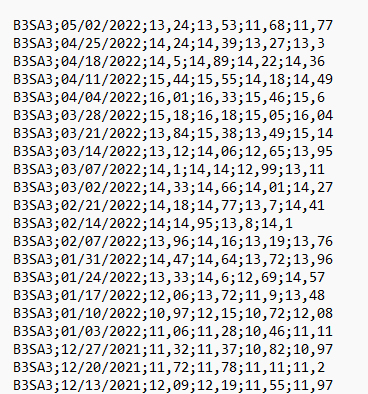
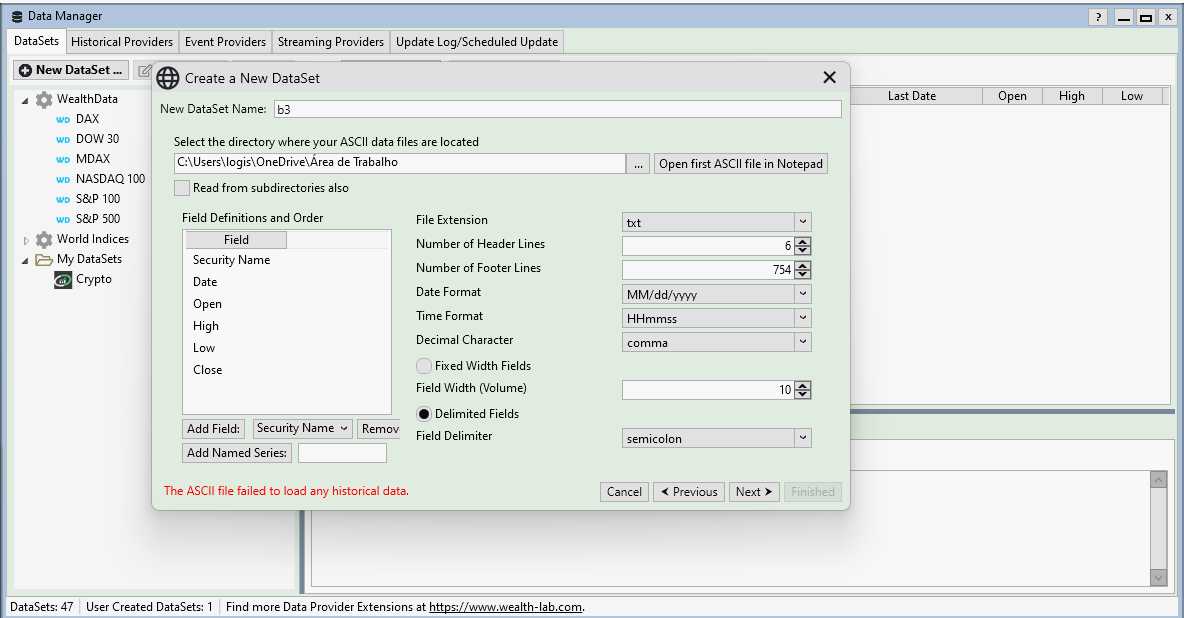
Obrigado a todos. Como exemblo eu criei uma base de dados em txt e tentei usar ela como dataset. Vou deixar a base de dados e a mensagem de erro que apreceu. Aguardo o feedback.
 .
.
.
Can you email us one of the files to support@wealth-lab.com so we can take a look?
But why did you define so many header and footer lines, is that really accurate?
But why did you define so many header and footer lines, is that really accurate?
Email enviado.
Elas foram só para fazer o exemplo. Qual seria a forma correta?
Elas foram só para fazer o exemplo. Qual seria a forma correta?
Header and footer lines are ignored, they're not part of the data.
Usually for ASCII data there is 1 header line (or none) and 0 footer lines. Try that.
Usually for ASCII data there is 1 header line (or none) and 0 footer lines. Try that.
By setting the number of footer lines to 754 you've filtered out the entire history from the 754-line ASCII file you sent us. Like Glitch and Cone suggested, make both header and footer a 0 - your file does not contain them.
Eram as linhas do cabeçalho e rodapé mesmo o problema. Obrigado a todos.
Glad to see you're up and running!
When posting could you use Google Translate to be understood not just by Brazilians?
https://translate.google.com
When posting could you use Google Translate to be understood not just by Brazilians?
https://translate.google.com
Olá, fiz um arquivo para usar como dataset. O arquivo tem dados de 2007 até 2022, mas o gráfico mostra só 2007 até 2009, gostaria de saber porque esse erro?
by https://translate.google.com/
Hello, I made a file to use as a dataset. The file has data from 2007 to 2022, but the graph only shows 2007 to 2009, I would like to know why this error?
by https://translate.google.com/
Hello, I made a file to use as a dataset. The file has data from 2007 to 2022, but the graph only shows 2007 to 2009, I would like to know why this error?
You can use Google Translate to be understood by the English speaking community:
https://translate.google.com
https://translate.google.com
QUOTE:
the graph only shows 2007 to 2009
It's difficult to tell, but one likely explanation is that the data range specified for your chart or backtest is from 2007 to 2009.
Your Response
Post
Edit Post
Login is required