So I ran Initialize, then I ran PreExecute{} to sort the results from Initialize. I'm skipping Execute{} because this relative stock visualizer/plotter doesn't trade, so Execute is not needed.
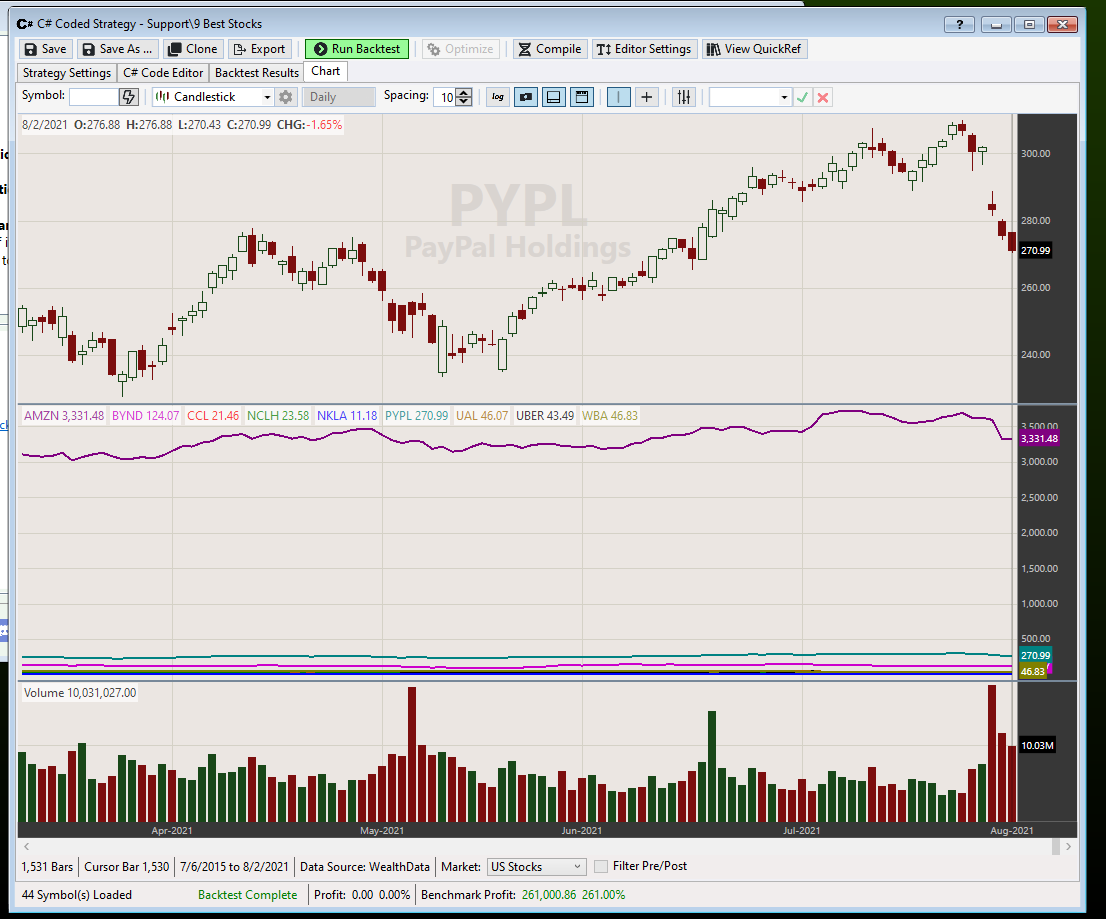
Now I want to plot the 9 best stocks I found in specific ranking order. Since the rank order is important, calling CleanUp{} is out of the question since it employs a random order. So I turned to BackTestComplete{}. That's a good plan, but now GetHistory() fails to be recognized in BackTestComplete{}. So now what do I do?
Did I mention this relative stock visualizer/plotter was easier to do on WL6?
---
UPDATE: I misspelled it. It should be GetHistory(), not GetBarHistory(). I also moved the sort to BacktestComplete(). Now there's a data problem, but there are plenty of bars for both SPX.XO and FNARX.
Now I want to plot the 9 best stocks I found in specific ranking order. Since the rank order is important, calling CleanUp{} is out of the question since it employs a random order. So I turned to BackTestComplete{}. That's a good plan, but now GetHistory() fails to be recognized in BackTestComplete{}. So now what do I do?
CODE:Is PreExecute{} called more than once? If so, maybe the sort should go somewhere else (like BackTestComplete).
public override void PreExecute(DateTime dt, List<BarHistory> participants) { Array.Sort(dipBuyMeritScore,fundSymbols); } public override void BacktestComplete() { for (int symIndx=fundSymbols.Length-1, colorIndx=0; colorIndx<plotColor.Length; symIndx--, colorIndx++) { BarHistory mutFundBars = GetHistory(standardFund,fundSymbols[symIndx]); //BarHistory mutFundBars = participants.Find(x => x.Symbol.Contains(fundSymbols[symIndx])); TimeSeries decorrelated = RSDif.Decorrelate(mutFundBars); decorrelated = decorrelated-decorrelated[decorrelated.Count-nullBar]; decorrelated.Description = String.Format("[{0:0#}] {1,5:0.00}/bar {2,5:0.00}/bar", colorIndx+1, LRSlope.Value(decorrelated.Count-1, decorrelated, 15), LRSlope.Value(decorrelated.Count-1, decorrelated, 30)) + " decorrelated(" + mutFundBars.Symbol + ") " + FidSelMutFundNameTerse(mutFundBars); bool highlight = colorIndx==plot2highlight; //highlight this plot? PlotTimeSeriesLine(decorrelated, "Fund comparison", "comparison", plotColor[colorIndx], 1, LineStyles.Solid); int lowestRecentBar = decorrelated.GetLowestBar(decorrelated.Count-1, 22); //lowest bar for past month int gainBars = decorrelated.Count - lowestRecentBar; //#of bars to determine recent price gains if (highlight) { TimeSeries regressionPlot = Regress.ReciprocalFit(decorrelated,0,gainBars); regressionPlot.Description = null; PlotTimeSeriesLine(regressionPlot,"Fund comparison","comparison",Color.Red,4,LineStyles.Dotted); } int dipBar = decorrelated.Count-gainBars; //bar# @dip pt DrawDot(dipBar, decorrelated[dipBar], plotColor[colorIndx], 5, "comparison"); PlotTimeSeriesLine(new WilderMA(new Momentum(decorrelated, 1), nullBar), "[" + (colorIndx+1) + "] WilderMA(Velocity(" + mutFundBars.Symbol + "))", "Velocity", plotColor[colorIndx], highlight ? 3 : 1, LineStyles.Solid); } }
Did I mention this relative stock visualizer/plotter was easier to do on WL6?
---
UPDATE: I misspelled it. It should be GetHistory(), not GetBarHistory(). I also moved the sort to BacktestComplete(). Now there's a data problem, but there are plenty of bars for both SPX.XO and FNARX.
CODE:
Timestamp   Source   Message   Exception
"8/2/2021 20:59:02:956"   "WL7"   "Specified argument was out of the range of valid values. (Parameter 'Index out of Range: ( RSDif(%chg of FNARX decorrelated w/SPX.XO), 300) ')"
Rename
QUOTE:
Now there's a data problem
That's just an ArgumentOutOfRange exception meaning that TimeSeries decorrelated is trying to access an index value that is either negative or exceeds the upper boundary of the index.
QUOTE:
That's just an ArgumentOutOfRange exception
Okay, I change the above code to what's below so it's mutFundBars.Close that's being sampled instead of RSDif.Decorrelate(mutFundBars).
CODE:I now get an ArgumentOutOfRange exception with the mutFundBars.Close. So are you saying there's a bug in the GetHistory() call in BacktestComplete() ?
TimeSeries decorrelated = mutFundBars.Close; //TimeSeries decorrelated = RSDif.Decorrelate(mutFundBars);
I did try plotting the fund in question, FSAGX, on a Chart, and it plots okay. So there's nothing wrong with the Close prices for that fund returned by Data Manager and Yahoo. It's some other problem.
Did I mention this strategy code works fine on WL6?
---
I just noticed something weird. The screenshot above shows fetching FSAGX failed for IQFeed. I wonder if that failure subsequently created the ArgumentOutOfRange exception for this fund, which immediately follows, because the two timestamps correspond? In other words, data failure attempts propagate into the strategy execution--a WL7 data recovery bug (... because of a thread scheduling problem?).
The issue looks like you are storing a list of stock data, then trying to plot all of those items in the list in one chart. The issue is that the items aren't synchronized to the chart you're plotting. Here is a minimal example. It determines the "best" 9 stocks in the DataSet. For simplicity, we'll say the stocks with the lowest RSI are "best". It then plots the stocks.
CODE:

using WealthLab.Backtest;
using System;
using WealthLab.Core;
using WealthLab.Indicators;
using System.Drawing;
using System.Collections.Generic;

namespace WealthScript1
{
    public class MyStrategy : UserStrategyBase
    {
        //Determine "the best 9 stocks in the DataSet"
        //BacktestBegin is called once at the start of the backtest, the context is the first symbol in the list of symbols being processed
        public override void BacktestBegin()
        {
         //add the BacktestData to this static list of stocks we'll be sorting
         bestStocks.AddRange(BacktestData);

         //for each stock in the list, calculate an RSI
         foreach(BarHistory bars in bestStocks)
         {
            RSI rsi = RSI.Series(bars.Close, 20);
            bars.UserData = rsi;
         }

         //sort the stocks by RSI, lowest RSI is best, so those will sort to top
         bestStocks.Sort((a, b) =>
         {
            RSI rsi1 = (RSI)a.UserData;
            RSI rsi2 = (RSI)b.UserData;
            return rsi1.LastValue.CompareTo(rsi2.LastValue);
         });
        }

        //Initialize
        public override void Initialize(BarHistory bars)
        {
         //plot the best 9 stocks, but be sure to synchronize them with the current BarHistory before plotting them
         RandomGdiColorFactory cf = new RandomGdiColorFactory();
         for (int n = 0; n < 9; n++)
         {
            if (n >= bestStocks.Count)
               break;
            Color c = cf.NextColor;
            BarHistory stock = bestStocks[n];
            stock = BarHistorySynchronizer.Synchronize(stock, bars);
            PlotTimeSeries(stock.Close, stock.Symbol, "Stocks", c);
         }
        }

        //Execute
        public override void Execute(BarHistory bars, int idx)
        {
        }

      //private members
      private static List<BarHistory> bestStocks = new List<BarHistory>();
    }
}
QUOTE:So you're saying the GetHistory() line below is inadequate to synchronize the different TimeSeries for the multi-plot. I didn't know that.
The issue is that the items aren't synchronized to the chart you're plotting.
CODE:My mistake was relying too much on GetHistory() doing the synchronization against the highest-ranking fund plotted. Thanks for correcting me on that.
BarHistory mutFundBars = GetHistory(standardFund,fundSymbols[symIndx]);
I will study your code to see how you're able to synchronize the Fidelity mutual funds better. I kind of thought these funds would be somewhat synchronized already, but I could be wrong. Thanks again!
GetHistory will synchronize against the symbol having context. But you are calling it BacktestConplete, which, as documented, executes only once and the context symbol is the last symbol in the DataSet.
To clarify, if I use the last stock in BacktestComplete() to synchronize with GetHistory(), would that be enough synchronization to combine these 9 stocks on one Chart?
Same question with List<BarHistory> participants from Pre/PostExecute. Are all the BarHistories in participants pre-synchronized so they can appear on the same plot?
Originally, I was going to use PostExecute() for the plotting, but it appeared to be called many times (and I only needed it called once) to produce the multi-stock plot. It might be nice if these two procedures had an optional Boolean parameter that when set "true" would cause the procedure not to return another time.
I appreciate all your clarifications. The docs don't really mention enough about synchronization.
>>Same question with List<BarHistory> participants from Pre/PostExecute. Are all the BarHistories in participants pre-synchronized so they can appear on the same plot?<<
No, these methods are intended to support things like code based rotation strategies, so it's important that they not be synchronized with any one master symbol. There's no specific master symbol anyway at this point to synch them with.
No, these methods are intended to support things like code based rotation strategies, so it's important that they not be synchronized with any one master symbol. There's no specific master symbol anyway at this point to synch them with.
I'm not sure about the first question, is the intention to detect and plot the "best N" stocks, and the best place to do that? I suggested doing it in BacktestBegin and then plotting them in Initialize. Are you asking if it's also possible to somehow do this in BacktestComplete?
QUOTE:Yes, yes. That's precisely what I want to do. I will try your example this weekend.
... the intention to detect and plot the "best N" stocks, and the best place to do that? I suggested doing it in BacktestBegin and then plotting them in Initialize.
Initialize() works much like WL6, where I already have this running. Is Initialize() the only possible place all the stocks will be "automatically" synchronized together so they can be placed on a multi-plot together?
I greatly appreciate your example with BacktestBegin. I've never seen an example like that. And it never occurred to me to do the sorting before Initialize(). And I didn't even know how to access the BacktestData in BacktestBegin.
QUOTE:If the BacktestBegin and Initalize approach work, then I don't need BacktestComplete. I'm just trying to get this multi-plot thing working.
Are you asking if it's also possible to somehow do this in BacktestComplete?
The Initialize() routine in Reply# 3 (reproduced below) with its FOR loop is executed 40 times for a 40 stock dataset. How can I re-write this so the FOR loop is only executed once?
CODE:Wouldn't if be better if the above FOR loop wasn't in Initialize() in the first place so it's not executed more than once? We only need this FOR loop to run once to generate the multi-plot.
//Initialize static readonly Color[] plotColor = {Color.Blue, Color.LimeGreen, Color.Magenta, Color.DeepSkyBlue, Color.Black, Color.DarkCyan, Color.DarkOrchid, Color.Coral, Color.Brown}; public override void Initialize(BarHistory bars) { //plot the best 9 stocks, but be sure to synchronize them with the current BarHistory before plotting them for (int n = 0; n < Math.Min(9,bestStocks.Count-1); n++) { BarHistory stock = bestStocks[n]; stock = BarHistorySynchronizer.Synchronize(stock,bars); PlotTimeSeries(stock.Close, stock.Symbol, "Stocks", plotColor[n]); SetPaneDrawingOptions("Stocks", 300, -1); } }
The reason it's in Initialize is that it is plotting 9 stocks in the context of the symbol being charted. Therefore, each item plotted needs to be synchronized to the context of the charted symbol.
Are you saying the mult-plot must be done in Initialize() only?
Can we just execute the FOR loop once rather than 40 times? How is this done?
I'm not getting the bigger picture here.
Can we just execute the FOR loop once rather than 40 times? How is this done?
I'm not getting the bigger picture here.
The purpose of the FOR loop is to enumerate the existing selected best stocks and to SYNCHRONIZE them to the plotted on the chart. Since each symbol in your DataSet might have different gaps or ranges in their data, the FOR loop needs to execute 40 times assuming there are 40 symbols in your DataSet.
QUOTE:Wasn't that done in Sort of PreExecute?
The purpose of the FOR loop is to enumerate the existing selected best stocks
QUOTE:That I understand. So SYNCHRONIZE kind of "interpolates" the missing data.
and to SYNCHRONIZE them to the plotted on the chart.
QUOTE:Now you lost me. SYNCHRONIZE needs to execute 9 times for the 9 stocks we are plotting, but we are calling SYNCHRONIZE 40*9 times. (And calling PlotTimeSeries() 40*9 times as well.) Why are we doing that? Bottom line, I don't understand how SYNCHRONIZE works under the hood.
Since each symbol in your DataSet might have different gaps or ranges in their data, the FOR loop needs to execute 40 times assuming there are 40 symbols in your DataSet.
As an experiment, I tried commenting out the SYNCHRONIZE line.
CODE:Running the strategy with SYNCHRONIZE commented out works probably because this is the Fidelity Select Sector funds dataset, which is already synchronized. However, the error log flags Index out of Range (799) when I do, so the SYNCHRONIZE line is still needed.
//stock = BarHistorySynchronizer.Synchronize(stock,bars);
>>Wasn't that done in Sort of PreExecute?<<
There's no PreExecute in my code example, I was basing this comment off my example.
>>That I understand. So SYNCHRONIZE kind of "interpolates" the missing data.<<
Yes, it does and allows the TimeSeries to be plotted on the symbol being charted.
>>Now you lost me. SYNCHRONIZE needs to execute 9 times for the 9 stocks we are plotting, but we are calling SYNCHRONIZE 40*9 times. Why are we doing that? Bottom line, I don't understand how SYNCHRONIZE works under the hood.<<
We are potentially plotting 9 different stocks for EACH of the 40 symbols in the DataSet. If you go through your symbols or positions in the backtest results and chart different symbols, each symbol will plot its own synchronized copies of the 9 stocks.
CODE:Sorry, I misspoke. I should have said BacktestBegin() instead. I'm running your example.
There's no PreExecute in my code example,...
QUOTE:
We are potentially plotting 9 different stocks for EACH of the 40 symbols in the DataSet. If you go through your symbols or positions in the backtest results and chart different symbols, each symbol will plot its own synchronized copies of the 9 stocks.
But I'm getting--and only want--one 9-plot graph. I don't need 40, 9-plot graphs. Why would I care about what the FSAGX fund is doing if it's not one of the 9 plots on the graph I'm looking for?
Perhaps if FSAGX was trading and a trade could somehow affect which stocks in the 9-plot collection would be selected, then there would be an issue. But this strategy doesn't trade at all. Why should funds (or stocks) not part of the 9-plot montage even matter? What am I missing?
I think you're missing the concept that the strategy could potentially be plotting these 9 stocks on ANY of the 40 stocks in your DataSet.
The FOR loop allows for error free plotting no matter which symbol in the DataSet you chart.
The FOR loop allows for error free plotting no matter which symbol in the DataSet you chart.
QUOTE:So Synchronize() must be called on all stocks in order to have flexibility on what gets plotted. And having said that, Synchronize() needs to be in the Initialize() method so all stocks are called.
the strategy could potentially be plotting these 9 stocks on ANY of the 40 stocks in your DataSet.
I think you answered my next question then. The code below is roughly identical to the Reply# 3 example with one major exception. It's designed so Synchronize() is not called more than once for any given stock in the dataset so it runs faster. But this is at the expense of creating a second list, plotStocks.
I was wondering why this second example works, but now I understand it meets the requirement of Synchronize() being called for each stock (even if it's only once). The bad news is this second example is slightly more complicated.
CODE:
using System.Collections.Generic;
using System.Drawing;
using WealthLab.Core;
using WealthLab.Backtest;
using WealthLab.Indicators;

namespace WealthScript7
{
   public class LowestRsiPlot : UserStrategyBase
   {
      static readonly Color[] plotColor = {Color.Blue, Color.LimeGreen, Color.Magenta, Color.DeepSkyBlue,
         Color.Black, Color.DarkCyan, Color.DarkOrchid, Color.Coral, Color.Brown};

      //Determine "the best 9 stocks in the DataSet"
      //BacktestBegin is called once at the start of the backtest, the context is the first symbol in the list of symbols being processed
      public override void BacktestBegin()
      {
         //add the BacktestData to this static list of stocks we'll be sorting
         bestStocks.AddRange(BacktestData);

         //for each stock in the list, calculate an RSI
         foreach(BarHistory bars in bestStocks)
         {
            RSI rsi = RSI.Series(bars.Close, 20);
            bars.UserData = rsi;
         }

         //sort the stocks by RSI, lowest RSI is best, so those will sort to top
         bestStocks.Sort((a, b) =>
         {
            RSI rsi1 = (RSI)a.UserData;
            RSI rsi2 = (RSI)b.UserData;
            return rsi1.LastValue.CompareTo(rsi2.LastValue);
         });

         plotStocks = bestStocks.GetRange(0,9); //pick the 9 top stocks to plot
      }

      //Initialize
      public override void Initialize(BarHistory bars)
      {
         if (plotStocks.Contains(bars)) return;
         //plot the best 9 stocks, but be sure to synchronize them with the current BarHistory before plotting them
         for (int n = 0; n < plotStocks.Count; n++)
         {
            BarHistory stock = plotStocks[n];
            stock = BarHistorySynchronizer.Synchronize(stock,bars);
            PlotTimeSeries(stock.Close, stock.Symbol, "Stocks", plotColor[n]);
            SetPaneDrawingOptions("Stocks", 300, -1);
         }
      }

      //Execute
      public override void Execute(BarHistory bars, int idx)
      {
      }

      //private members
      static List<BarHistory> bestStocks = new List<BarHistory>();
      static List<BarHistory> plotStocks = new List<BarHistory>();
   }
}
Thanks a million for all your insights. I "kind of" understand, although it's fuzzy around the edges.
Your Response
Post
Edit Post
Login is required