I don’t know how it works under the hood, but I guess there are three stages of backtesting – data loading (you’ll see a progress bar), backtesting itself (you’ll see spinning dots), metrics calculating (when dots are stopped and WL7 UI is frozen).
When I backtest on D1 for example metrics calculating (I guess that’s it, I’ve described what I mean by that) takes relatively small time. But when I use m5 metrics calculating time times bigger than “spinning dots” phase.
Strategy is the same. One ticker. 20 years of data. 4500 trades in total. I have an extension installed that has an extra score card (Extended ScoreCard) – if that matters. It took 30 seconds for “spinning dots” (and it looks OK for this amount of data for my laptop maybe) and it took 4 minutes to calculate metrics! I think there is something that could be improved there.
Rename
what does D1 and M5 mean?
Daily and 5-minute (Forex lingo).
QUOTE:
Strategy is the same
Yes but there are 100-200 times more data to process for the scorecard, don't you think so?
12 m5 bars -> 78 times (U.S. market) to 288 times (cryptos)
QUOTE:
Yes but there are 100-200 times more data to process for the scorecard, don't you think so?
12 m5 bars -> 78 times (U.S. market) to 288 times (cryptos)
First of all am I right with my phazes extracting?
If so - backtest (middle) phaze looks OK - it deals with more candles so it lasts relatively longer. I may be wrong but metrics calculating phaze deals with trades only? - If so - there are only 5K trades there - nothing close to cause 4 minutes processing time. So there is definitely some inefficiency there. Something with exponential processing complexity maybe as it causes time consuming so much.
QUOTE:
what does D1 and M5 mean?
Yes it's Daily and 5-minute timeframes.
I did some more experimenting:
time format: mm:ss
b: backtest (phaze with spinning dots)
m: metrics (phaze with frozen UI)
All for 5-minute TF, 20 years, 1 symbol.
1. My strategy: b 00:43 m 03:50
2. WL7 built-in Dynamic Breakout System: b 00:20 m 03:35
3. WL7 strategy 10 tickers dataset: b 01:32 m 05:07
Retain NSF turn on/off doesn't affect a lot - I tried both.
The Extended scorecard contains numerous performance metrics which take into account not only trades but the equity curve bar by bar. To speed things up you should make Basic scorecard your default choice. Next strategy run will use the presumably faster Basic scorecard. Also make sure that Preferences > Metric Columns does not contain metrics from the Extended scorecard.
I thought that could be the reason, but I wasn't sure which extension includes this scorecard and how to turn it off). Thanks Eugene, I'll experiment with this.
You're welcome. It's the PowerPack extension, just for record.
To make everything right… I uninstalled WL7 and all the extensions) – so no extensions involved in these experiments. Then I made my experiments. These are results (with some comments):
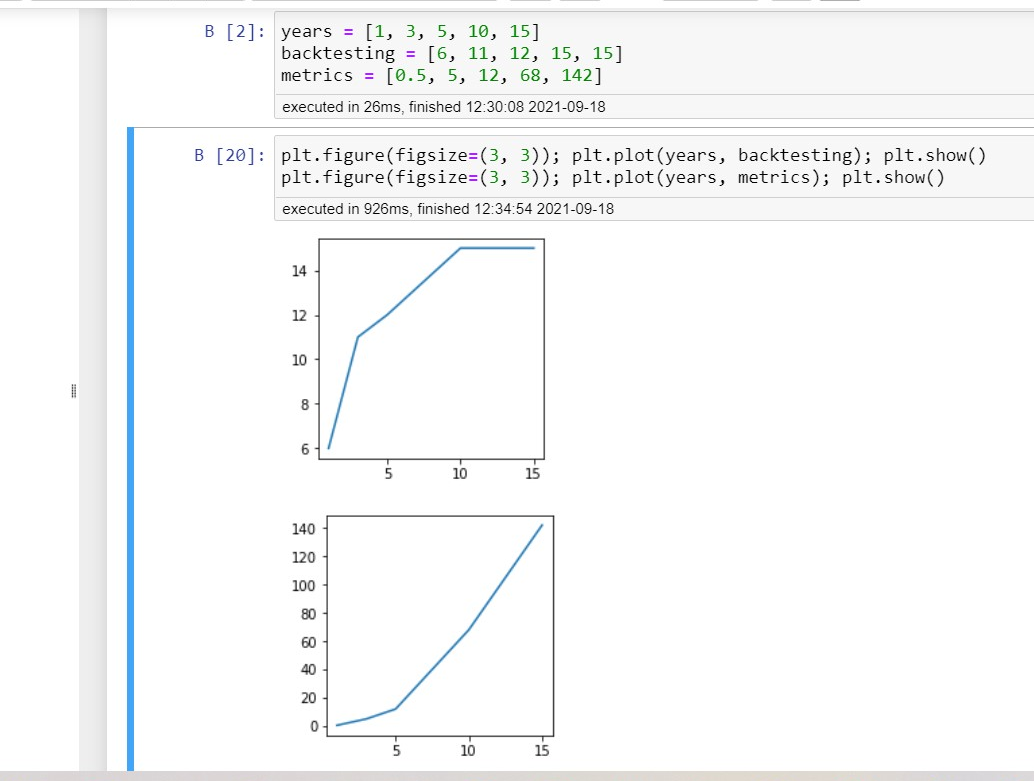
Still: 1 symbol, 5-minute TF. "years” array = how many years were involved during a backtest (5 backtests in common). “backtesting” array – seconds for “spinning dots” phase. “metrics” array – seconds for “frozen UI” phase. First chart is for spinning dots, second is for frozen dots. First one looks absolutely OK. It’s not linear because of some constant time consuming something + relative time consuming something. But the second one is exponentially growing. No excuses for this)). I’m scared to imagine total time for 1-minute timeframe 20 years for example. Or I’ve recently met mentions about 1 second candles, I guess…
Still: 1 symbol, 5-minute TF. "years” array = how many years were involved during a backtest (5 backtests in common). “backtesting” array – seconds for “spinning dots” phase. “metrics” array – seconds for “frozen UI” phase. First chart is for spinning dots, second is for frozen dots. First one looks absolutely OK. It’s not linear because of some constant time consuming something + relative time consuming something. But the second one is exponentially growing. No excuses for this)). I’m scared to imagine total time for 1-minute timeframe 20 years for example. Or I’ve recently met mentions about 1 second candles, I guess…
So it took less than a second for 1 year period (frozen dots phaze) and more than a minute for 10 years.
I'm not sure what I'm looking at really, but how many trades are involved in the intraday tests? Things slow down a lot when Lists become weighted down with tens of thousands of elements.
.. and as I'm typing that, I'm wondering that if using "intermediate lists" as buffers would help. In other words, add items to a List up to say, 500 elements. Then AddRange() to a main list. Let's see what Glitch thinks about it?
.. and as I'm typing that, I'm wondering that if using "intermediate lists" as buffers would help. In other words, add items to a List up to say, 500 elements. Then AddRange() to a main list. Let's see what Glitch thinks about it?
4000 positions), Retain NSF - off. Use Granular... - off.
CODE:

Metric   Model   Benchmark   Long   Short
Summary
Profit   -150095,36990709603   -4,521376714581252E+61   -150095,36990709603   0
Profit %   -0,15009536990709604   -4,6630748130867504E+55   -0,15009536990709604   0
Profit Per Bar   0,05364393329310666   0,021662432457061613   0,05364393329310666   не число
APR   -0,01022756176244366   не число   -0,01022756176244366   0
Exposure   0,023937491080872064   0   0,023937491080872064   0
Alpha (α)   не число   не число   не число   не число
Beta (β)   не число   не число   не число   не число
Sharpe Ratio   -74,21474098183899   6,762312391459981   -74,21474098183899   не число
Sortino Ratio   -115,22602502845686   6,847077746812742   -115,22602502845686   не число
WL Score   -42,795756111963556   0   -42,795756111963556   0

Interest & Commission
Commission Paid   230819,25990749922   75872,62452   230819,25990749922   0
Cash Interest Received   0   0   0   0
Margin Interest Paid   -0   -4,521376714581252E+61   -0   -0
Dividends Received   0   0   0   0

Positions
Position Count   3260   1   3260   0
Avg Profit   -46,04152451150306   135448837,46548   -46,04152451150306   не число
Avg Profit %   -0,0981204161087228   133,89101634718304   -0,0981204161087228   не число
Profit Factor   0,8359377445274686   не число   0,8359377445274686   не число
Payoff Ratio   1,902368588630538   не число   1,902368588630538   не число
Avg Bars Held   48,3159509202454   312814   48,3159509202454   не число
Avg Trades Per Month   36,836158192090394   0,005917159763313609   36,836158192090394   0
NSF Position Count   0   0   0   0

Drawdown
Max Drawdown   -162997,57065710425   -4,521376714581252E+61   -162997,57065710425   0
Max Drawdown Date   02.09.2021   03.09.2021   02.09.2021   01.01.0001
Max Drawdown %   -0,16297667260819132   -4,153851170544151E+55   -0,16297667260819132   0
Max Drawdown % Date   02.09.2021   03.09.2021   02.09.2021   01.01.0001
Recovery Factor   -0,9208442144383219   -1   -0,9208442144383219   не число

Profitable Positions
Count   994   1   994   0
% Profitable   30,49079754601227   100   30,49079754601227   0
Avg Profit   769,3893463179073   135448837,46548   769,3893463179073   не число
Avg Profit %   1,6225106139640142   133,89101634718304   1,6225106139640142   не число
Average Bars Held   87,11871227364185   312814   87,11871227364185   не число

Unprofitable Positions
Count   2266   0   2266   0
% Unprofitable   69,50920245398773   0   69,50920245398773   100
Avg Loss   -403,73714922661077   не число   -403,73714922661077   не число
Avg Loss %   -0,8528897205625195   не число   -0,8528897205625195   не число
Avg Bars Held   31,294792586054722   не число   31,294792586054722   не число
As a side comment: Profit % for benchmark looks very strange too).
Then it's probably not the Position or Transaction lists.
Maybe (just guessing ?) the slow down is due to synchronization factors. At least back in the Version 6 days, bar-by-bar returns had to be synchronized, and that process is a lot more involved with intraday data, especially when illiquid symbols are involved.
Maybe (just guessing ?) the slow down is due to synchronization factors. At least back in the Version 6 days, bar-by-bar returns had to be synchronized, and that process is a lot more involved with intraday data, especially when illiquid symbols are involved.
Mmmm I just ran some 5 minute backtests with 15,000 bars of data for 20+ symbols, over 5k trades, and am not seeing this. Post backtest update completed in 4 seconds.
I know this doesn’t help, but, could it be a case of less powerful hardware?
I know this doesn’t help, but, could it be a case of less powerful hardware?
QUOTE:
Mmmm I just ran some 5 minute backtests with 15,000 bars of data for 20+ symbols, over 5k trades, and am not seeing this. Post backtest update completed in 4 seconds.
I know this doesn’t help, but, could it be a case of less powerful hardware?
If only it's a very biased hardware)), that likes backtest and hatest postbacktest processing)).
I think we determined you were testing with 20 years of 5 minute data. I will get some comparable sized data and see if there are any bottlenecks we can address. My suspicion is it would be in the area of populating the visualizers.
Dion, you could use the Random provider to generate dummy data?
Could you please look into this closer - small timeframes' Big Data is waiting for me)).
I still haven't been able to get a DataSet of 335,000 bars, which is what you indicated you're backtesting on. How many symbols with this many bars in the backtest? I mean, this is quite a bit of data and it requires some time to crunch, but it sounds like the main pain point here is loading the Visualizers. I'd try removing all but the ones you most absolutely need. We can also maybe record some metrics on how long each visualizer takes to populate, that might help determine which need optimizing.
QUOTE:
I still haven't been able to get a DataSet of 335,000 bars, which is what you indicated you're backtesting on.
I can send one to you)).
QUOTE:
How many symbols with this many bars in the backtest?
For example I use five 1.5M-bars symbols dataset now. And Post backtest update have been processing... for an hour or so already). Exponentiality can really go crazy)).
QUOTE:
I'd try removing all but the ones you most absolutely need.
Are you talking about turning off visualizers on my side? - I think I can't control one. Preferences - Metric column is for optimization, or what are you tailking about?
QUOTE:
We can also maybe record some metrics on how long each visualizer takes to populate, that might help determine which need optimizing
Much appriciated!
I'm talking about Preferences, Backtest Settings, Visualizers. You can disable the ones you don't really need.
Oh, you are right! I'll experiment with this, thanks.
After my research:
You should definitely look closer into By Symbol visualizer))).
Others are unquestionably fast, but this one is very-very suboptimal).
I use By Symbol quite often, but I can use unchecking it as a workaround - no problem. But fixing this is much appreciated.
You should definitely look closer into By Symbol visualizer))).
Others are unquestionably fast, but this one is very-very suboptimal).
I use By Symbol quite often, but I can use unchecking it as a workaround - no problem. But fixing this is much appreciated.
I had a feeling and almost even suggested that. By Symbol needs to do a lot of calculations examining all the positions, for each and every symbol. i’m not sure how much we’d be able to improve this but i suppose it’s possible.
I wouldn’t consider it’s something that needs fixing, but it’s a possibility it could be optimized.
I wouldn’t consider it’s something that needs fixing, but it’s a possibility it could be optimized.
I think we’ll do those calculations in a background thread which will make the visualizer more immediately responsive.
Dion, since each symbol is completely independent of each other in the context of By Symbol's calculations, let me also suggest parallelizing the per symbol loop to gain advantage of multi-core CPUs.
Guys, steps you've describe look extensive, but you need something intensive I guess). I do not really know what is under the hood, but I'm a trader - I never know what is under the hood, what I can see are metrics and data only. Ok, let's say by symbol calculations need to separate data, and then do all the calculations for every ticker. I made my backtests yesterday with five 1.5M bars Symbols. So total time for By Symbol should look like (5 * MetricsVisualizerCalculationTime + GettingSeparatedDataTime), but Metrics visualizer calculation takes a couple of seconds, and By Symbol takes ages (I stoped the process after an hour) only for 5 Symbols.
OK, the By Symbol Visualizer just got a new lease on life with several MAJOR optimizations. Be sure to check out the different in B25 once it's released!
QUOTE:
OK, the By Period Visualizer just got a new lease on life with several MAJOR optimizations. Be sure to check out the different in B25 once it's released!
I really hope your By Period improvement will affect By Symbol visualizer :)).
If being serious, thanks a lot, i'll check that.
Edited thanks!
Looks like it's back. Maybe it's b28->b29 transition. Maybe it's closed equity curve calculations. Anyway as it's changed for b30, I'll wait for it to check.
Dion has fixed the closed equity algo so expect a speed boost from the Equity tab in B30.
Your Response
Post
Edit Post
Login is required