WL7 b14:
WL6.9:
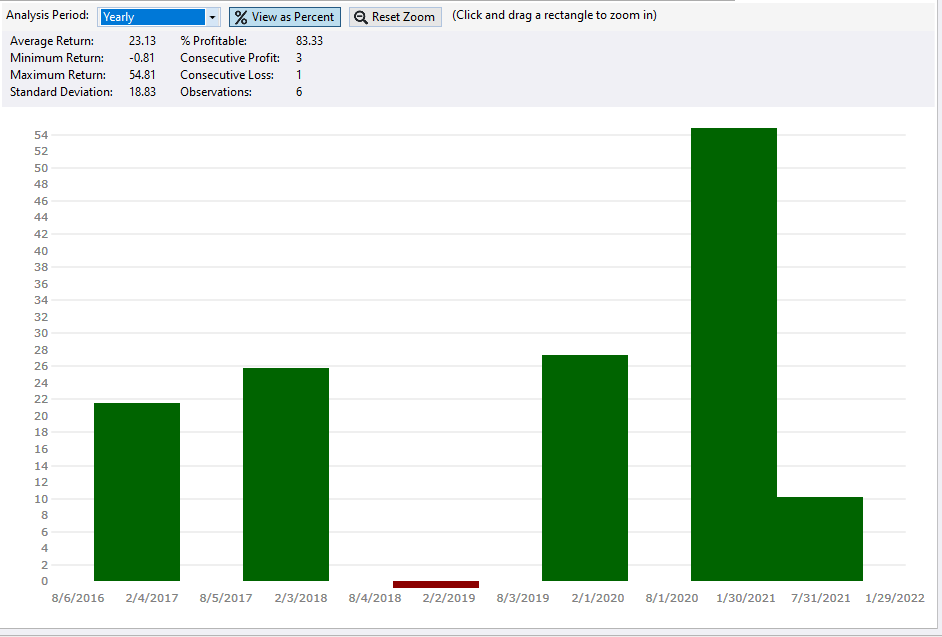
The x-axis in WL7 is half-yearly for Yearly Returns, it ought to be yearly (as illustrated for WL6).
Do I need to change some setting somewhere?
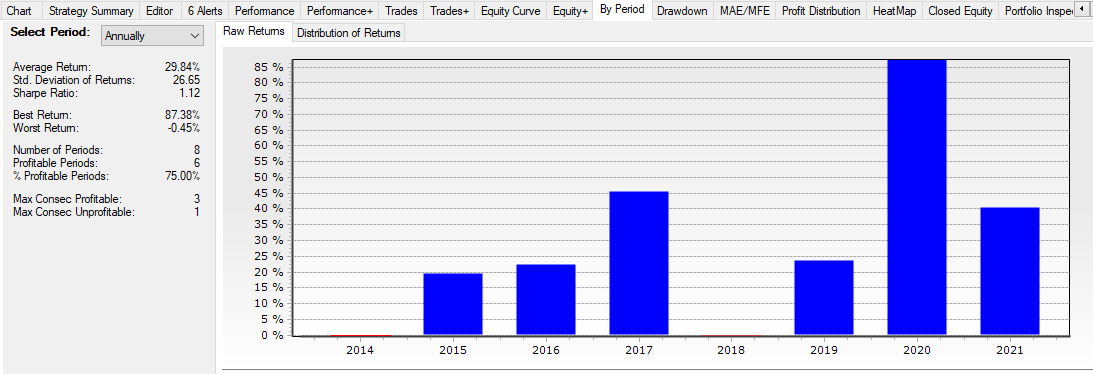
WL6.9:
The x-axis in WL7 is half-yearly for Yearly Returns, it ought to be yearly (as illustrated for WL6).
Do I need to change some setting somewhere?
Rename
i think we can clean up that scale for the next release. thanks for pointing this out.
A suggestion:
It would add *major* value to the bar charts if one can also plot the benchmark's performance alongside as an option (just as one can in the Equity Curve plot), like so:
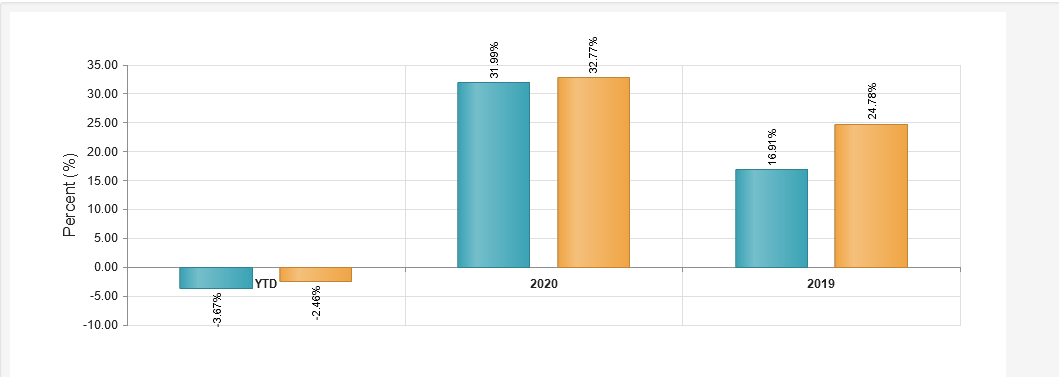
(vertical values above/below bars optional... but create a very cool effect)
This would make most sense for the Yearly and Quarterly periods, perhaps even Monthly.
It would add *major* value to the bar charts if one can also plot the benchmark's performance alongside as an option (just as one can in the Equity Curve plot), like so:
(vertical values above/below bars optional... but create a very cool effect)
This would make most sense for the Yearly and Quarterly periods, perhaps even Monthly.
I agree, working on adding the benchmark option to this visualizer.
Your Response
Post
Edit Post
Login is required