I have a static time series like that of an equity curve for a whole portfolio that I would like to plot as shown in code is shown below.
However, how come the equity curve is different after each run?
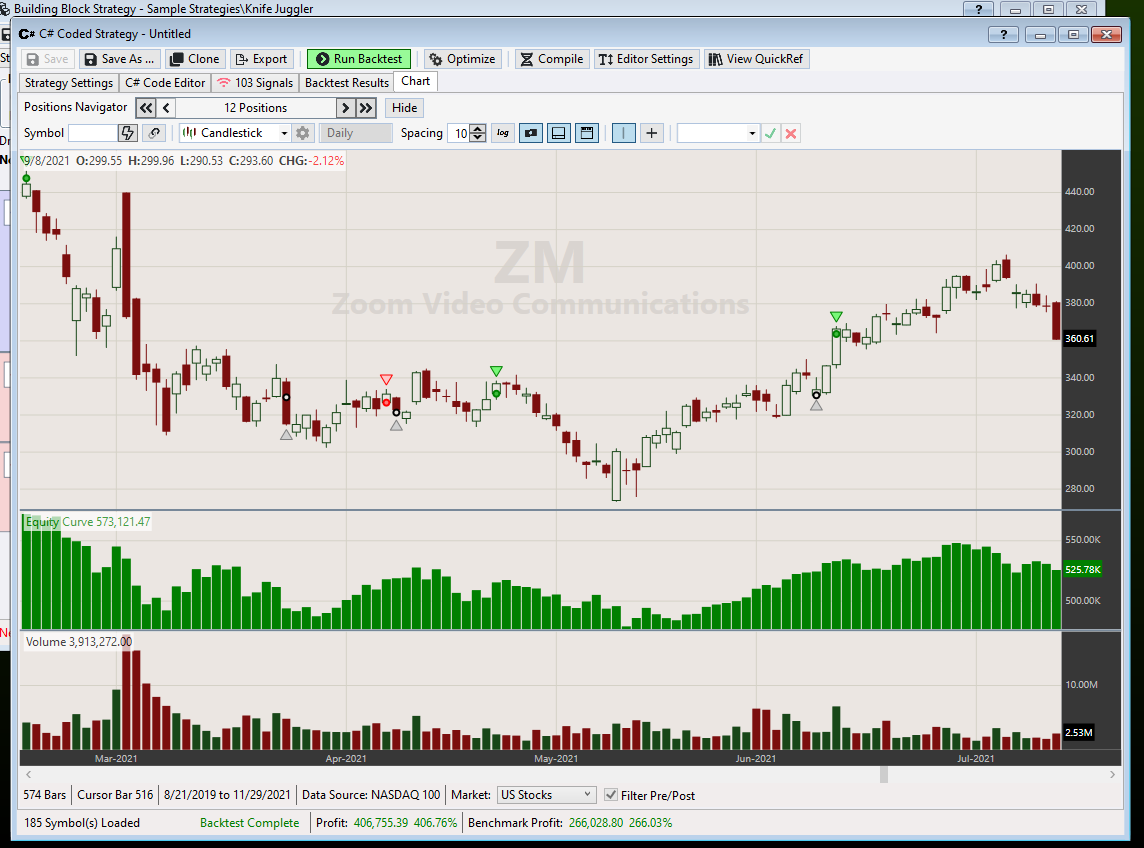
How is the equity curve plot related to the symbols in the Backtest Results tab? Depending on which symbol is being clicked on, the equity curve might be different. Most symbols in the Backtest Results when clicked on do not provide the equity curve plot. Thanks.
CODE:
using WealthLab.Backtest;
using System;
using WealthLab.Core;
using WealthLab.Indicators;
using System.Drawing;
using System.Collections.Generic;

namespace WealthScript10
{
    public class MyStrategy : UserStrategyBase
    {
        //create indicators and other objects here, this is executed prior to the main trading loop
        public override void BacktestBegin()
        {
            equity_plot = new TimeSeries(BacktestData[0].DateTimes);
         PlotTimeSeries(equity_plot, "equity", "equity", Color.Red, PlotStyles.Line);
        }


        public override void Initialize(BarHistory bars)
        {
        }

        //execute the strategy rules here, this is executed once for each bar in the backtest history
        public override void Execute(BarHistory bars, int idx)
        {

        }

        public override void PostExecute(DateTime dt, List<BarHistory> participants)
        {
         int bar = GetCurrentIndex(participants[0]);
         equity_plot[bar] = 123;
        }

      //declare private variables below
      private static TimeSeries equity_plot;


   }
}
However, how come the equity curve is different after each run?
How is the equity curve plot related to the symbols in the Backtest Results tab? Depending on which symbol is being clicked on, the equity curve might be different. Most symbols in the Backtest Results when clicked on do not provide the equity curve plot. Thanks.
Rename
If you want to plot the equity curve, the best place to do it is in the CleanUp method. This is run for every symbol after the main Execute loop completes. By this time, the equity curve is calculated.
For each individual symbol to plot the equity curve, it needs to be synchronized first. This is because each symbol in your backtest might have a different range of data, missing bars, etc. So the combined equity curve that's created by the Backtester needs to synchronize to the chart symbol being plotted.
Here's the CleanUp method to use ...
CODE:

//plot the equity curve in the chart
public override void Cleanup(BarHistory bars)
{
    TimeSeries chartEqCurve = TimeSeriesSynchronizer.Synchronize(Backtester.EquityCurve, bars);
    PlotTimeSeries(chartEqCurve, "Equity Curve", "EC", Color.Green, PlotStyles.ThickHistogram);
}
QUOTE:
Most symbols in the Backtest Results when clicked on do not provide the equity curve plot.
If it's a W-D DataSet, can they be excluded from the backtest results by the data loading range - like delisted symbols?
Thanks Glitch and Eugene for the quick response and for the code. Yes, moving the equity curve plotting to CleanUp() method makes sense. However, why is the equity curve is different for each run? I have a fixed position size setting and no slippage is being used.
Eugene, I am not sure I understand your question above.
QUOTE:
If it's a W-D DataSet, can they be excluded from the backtest results by the data loading range - like delisted symbols?
Eugene, I am not sure I understand your question above.
Check the FAQ on that, the primary reason the equity curve changes from run to run is insufficient simulated capital to take all backtest positions.
Thank you Glitch, I will check that out.
Eugene, the data I used for the simulations are from IQFeed and NOT from WealthLab Data - if this is what you are referring to. I can and will do a data quality check like missing bars and delisted symbols before running simulations to make it smoother and more accurate. Thanks.
Eugene, the data I used for the simulations are from IQFeed and NOT from WealthLab Data - if this is what you are referring to. I can and will do a data quality check like missing bars and delisted symbols before running simulations to make it smoother and more accurate. Thanks.
QUOTE:
Thank you Glitch, I will check that out.
Specifically, "Every time I run a Strategy I get a different result. Why?"
Thanks Eugene.
Your Response
Post
Edit Post
Login is required