Hello,
I'm new here and I'm from Germany.
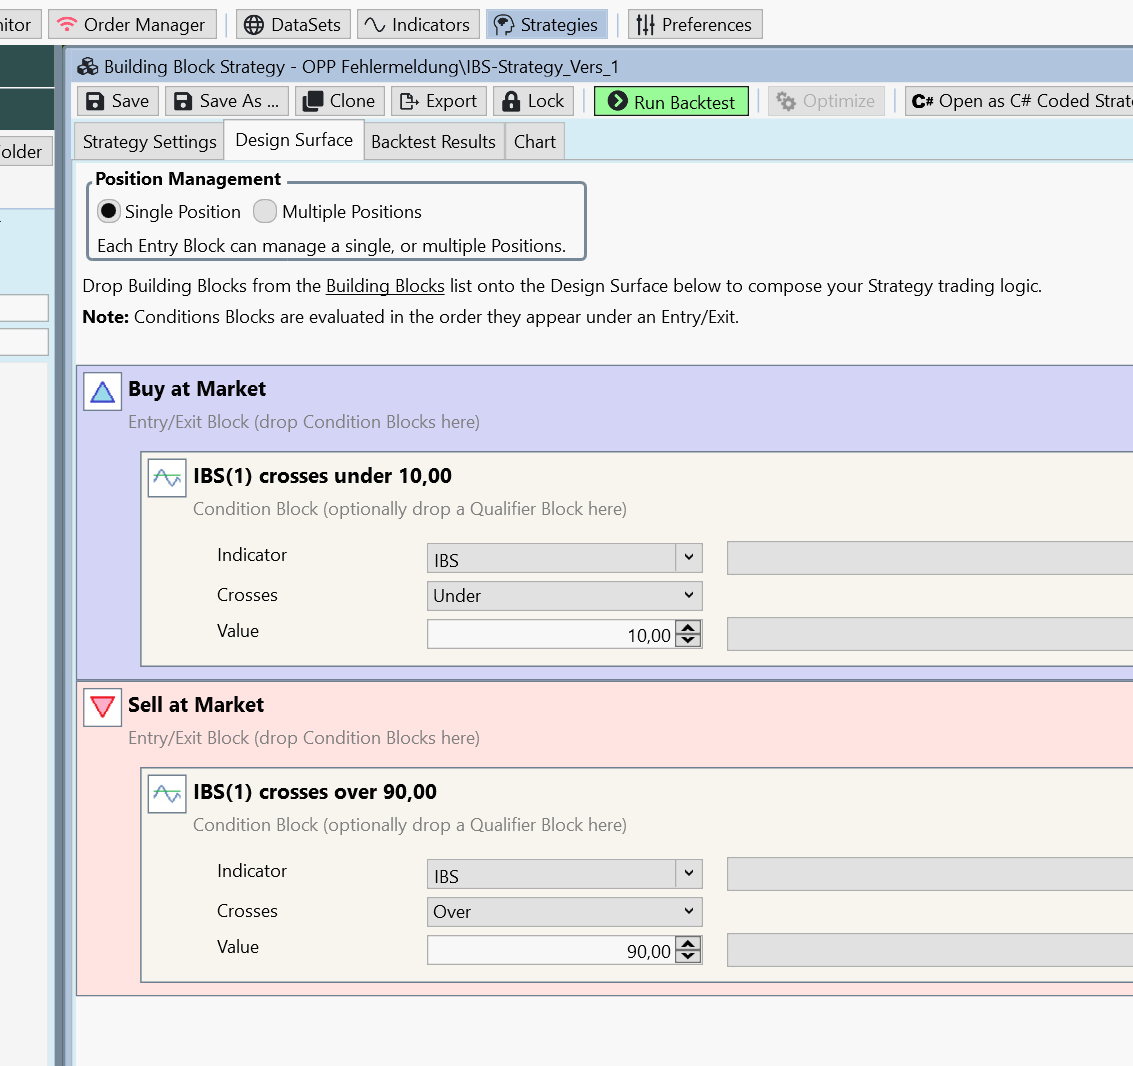
I recreated Volker's video:
(https://www.youtube.com/watch?v=by3-HVSCcPs)
IBS - A powerful indicator making over 300% in 10 years.
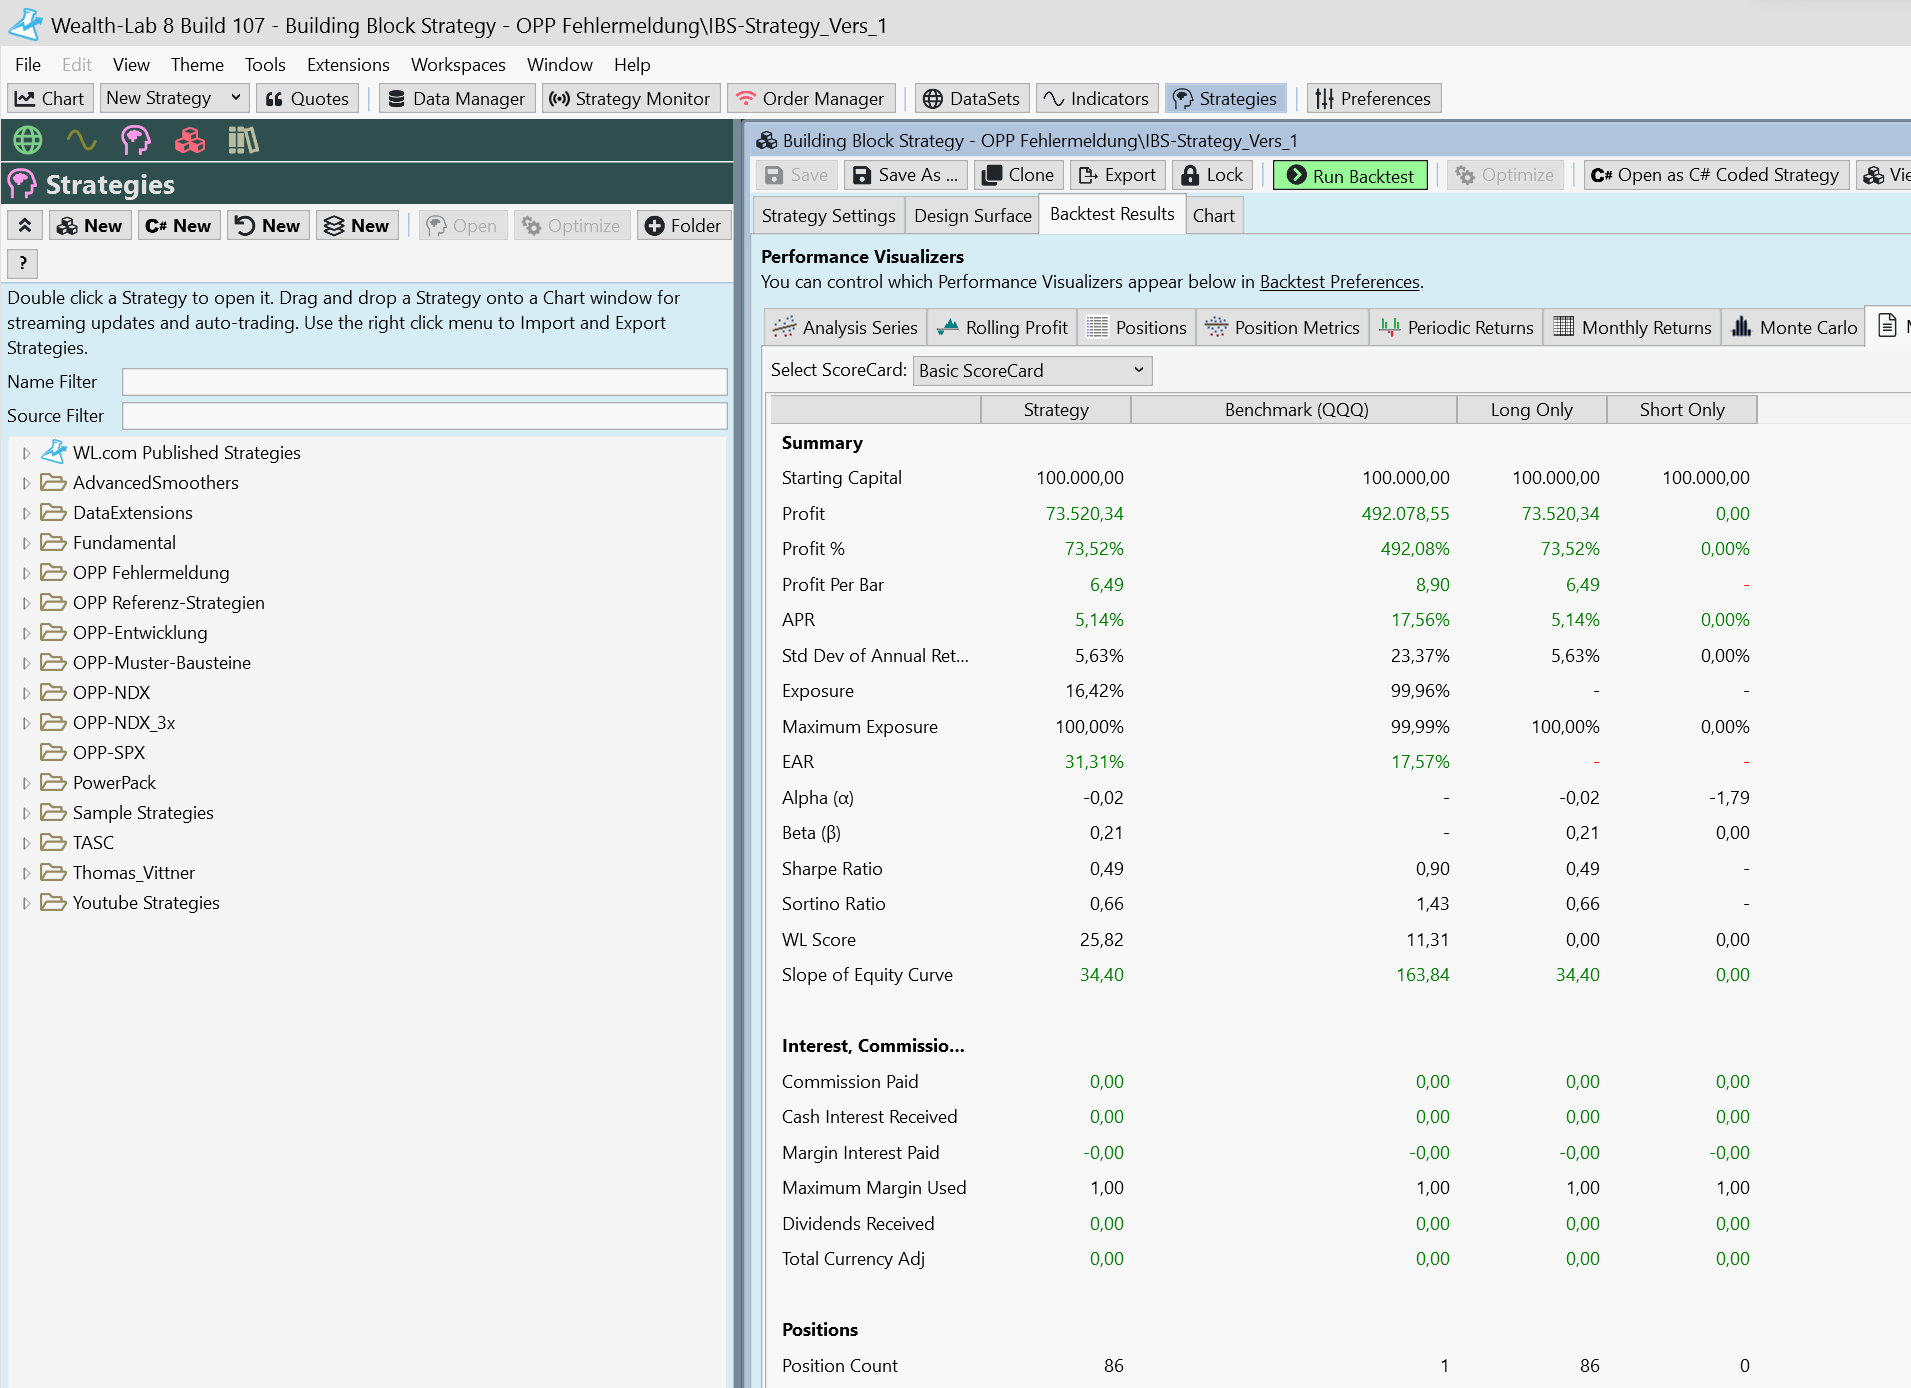
After backtesting, unfortunately only 73.2% could be found.
Where is my mistake?
Thank you in advance
Thomas
I'm new here and I'm from Germany.
I recreated Volker's video:
(https://www.youtube.com/watch?v=by3-HVSCcPs)
IBS - A powerful indicator making over 300% in 10 years.
After backtesting, unfortunately only 73.2% could be found.
Where is my mistake?
Thank you in advance
Thomas
Rename
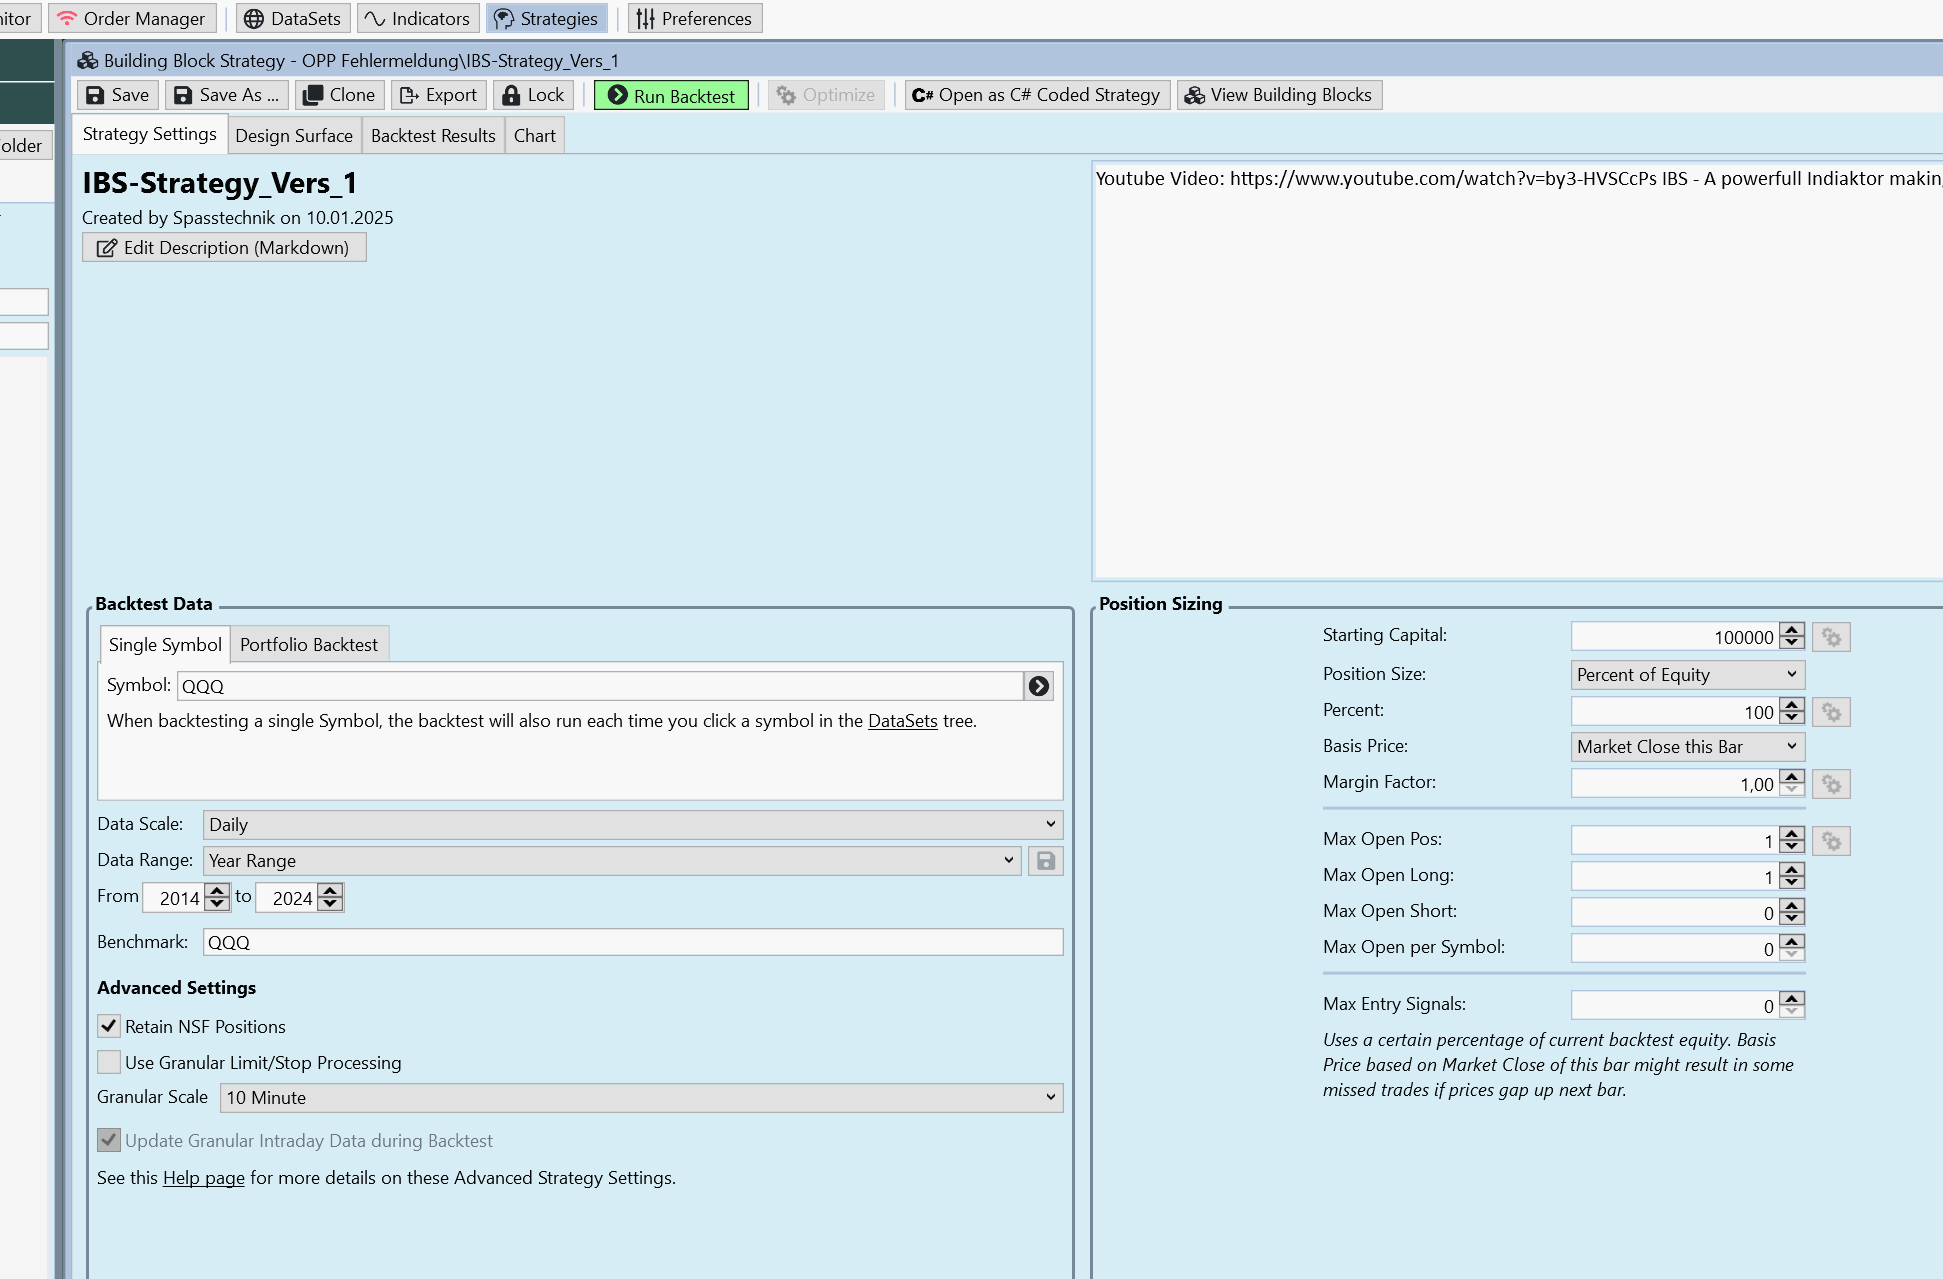
Without looking into it, you're using 100% of equity. If you do that, you need to either backtest with Basis Price set to Market Open Next Bar, or put your Margin at 1.1 or something above 1.0. If you don't, you'll be missing many, many Market order trades with QQQ and any other instrument that gaps higher on the open. In other words, NSF positions.
For those interested, I converted this strategy to code below.
In addition, some websites (see link in code) indicate this indicator ranges from 0-1, but the WL8 version ranges from 0-100.
In addition, some websites (see link in code) indicate this indicator ranges from 0-1, but the WL8 version ranges from 0-100.
CODE:
using WealthLab.Backtest;
using WealthLab.Core;
using WealthLab.Indicators;

namespace WealthScript1
{
   //www.quantifiedstrategies.com/internal-bar-strength-ibs-indicator-strategy/
   public class IbsDemo : UserStrategyBase
   {
      IndicatorBase ibs;

      public override void Initialize(BarHistory bars)
      {
         ibs = IBS.Series(bars,1);
         PlotIndicator(ibs);
      }

      public override void Execute(BarHistory bars, int idx)
      {
         if (HasOpenPosition(bars, PositionType.Long))
         {
            //sell conditions below
            if (ibs[idx] > 90.0)
               PlaceTrade(bars, TransactionType.Sell, OrderType.Market, 0.0, "IBS high sell");
         }
         else
         {
            //buy conditions below
            if (ibs[idx] < 10.0)
               PlaceTrade(bars, TransactionType.Buy, OrderType.Market, 0.0, "IBS low buy");
         }
      }
   }
}
Hello Cone,
As you suggested, I increased the margin to 1.1.
And you have the rest, the profit has risen to 351 T!
Very good! That was the leverage.
Thank you very much!
But in Volker's video, over 400 T was calculated.
There is still a small amount of 50 T missing.
I'll calculate it here first.
Thomas
As you suggested, I increased the margin to 1.1.
And you have the rest, the profit has risen to 351 T!
Very good! That was the leverage.
Thank you very much!
But in Volker's video, over 400 T was calculated.
There is still a small amount of 50 T missing.
I'll calculate it here first.
Thomas
Hello superticker,
I have compiled your code and it works perfectly.
In the first test from 2014-2024 (like Volker's video) the QQQ also came out at 351 T.
There are also about 50 T missing!
Only Vokler K. probably knows the answer.
Thank you very much anyway.
Thomas
I have compiled your code and it works perfectly.
In the first test from 2014-2024 (like Volker's video) the QQQ also came out at 351 T.
There are also about 50 T missing!
Only Vokler K. probably knows the answer.
Thank you very much anyway.
Thomas
Commissions?
Include dividends in backtest?
Include dividends in backtest?
Is the code above this:
https://www.wealth-lab.com/blog/build-a-profitable-mean-reversion-strategy-using-the-ibs-indicator
Thank you
https://www.wealth-lab.com/blog/build-a-profitable-mean-reversion-strategy-using-the-ibs-indicator
Thank you
QUOTE:
Is the code above this:
Yes, the strategies appears to be the same. The only difference is the C# code in Post #2 is employing inequalities for trading; whereas, the blog article is suggesting crossovers. I like the former better because it executes much faster. However, if you're working with an indicator with a great deal of "jitter" (leading to multiple triggers at the threshold point), then the crossover approach may be worth the extra CPU cycles.
The second advantage of using inequalities over crossovers is to catch missed opportunities on the following day. The crossover entry is a one-time event. In contrast, my strategies are coded (custom C# class) so if I miss the trade on one day, I still get a second signal to try again on the following day (or two). I like it that way.
Your Response
Post
Edit Post
Login is required