I would like you use a SMA filter based S&P 100. Two issues:
1) The OEX data is distorted. In WL 6,9 corret data was available.
2) The conditions "indicator compare with indicator" combined with the qualifier "indicator symbol OEX" does not work. The sma is then caluculated on OEX and compared to the individual stock. I would like have it compared with the OEX.
Ref data for indices: The Vix is only included starting with Jan 2021. In WL 6.9 there was the full picture.
Thanks for your support!
Something simlar I run into when using the VIX (When entering OEX I receive very
Rename
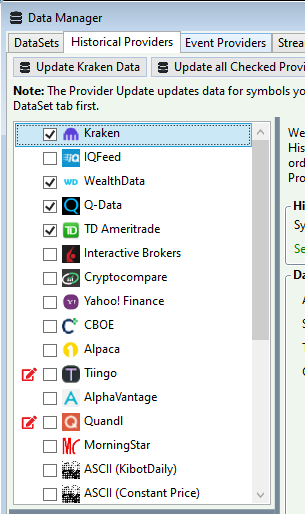
What symbols are you using for OEX and VIX and what Providers do you have enabled - and in what order?
For example, out of the list here, only the 4 providers checked will be used to get data in the order they appear from top to bottom (you can drag and drop to change the order).
For example, out of the list here, only the 4 providers checked will be used to get data in the order they appear from top to bottom (you can drag and drop to change the order).
Thanks, Cone.
The data issue I could solve. Appears to me that Yahoo Data is for indices the best source. I am using for example ^OEX which works fine.
However, I still asking myself how do deal with a index filter when deciding to trade a specific stock or not. The filter should show whether the S&P is above is 100 EMA or not. In WL 6.9 you could perfectly build such a strategy with the external symbol indicator. In WL 7 I am lost.
The condition "Indicator compare to Indicator" combined with the qualifier "Indicator symbol ^OEX" does work. If you need the SMA calculated on ^OEX and compared to the ^OEX, shouldn't you run the strategy on ^OEX then? The purpose of having the qualifier is to apply the indicator to the external symbol (^OEX) while running the strategy on another symbol e.g. SPY.
Maybe it would be more clear if you name the Rule(s) you're using in WL6 to accomplish your task? Then we could find an equivalent in WL7 (or add it to the product backlog if it doesn't exist).
Maybe it would be more clear if you name the Rule(s) you're using in WL6 to accomplish your task? Then we could find an equivalent in WL7 (or add it to the product backlog if it doesn't exist).
Please see attached example. Hopefully, this makes it a bit clearer.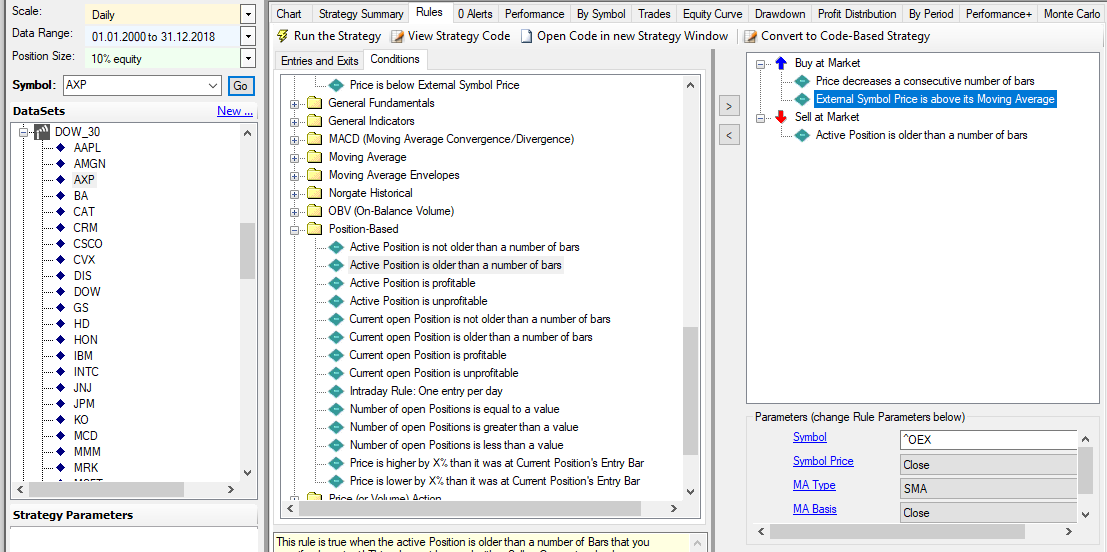
I'm not a drag and dropper, but does this work for you?
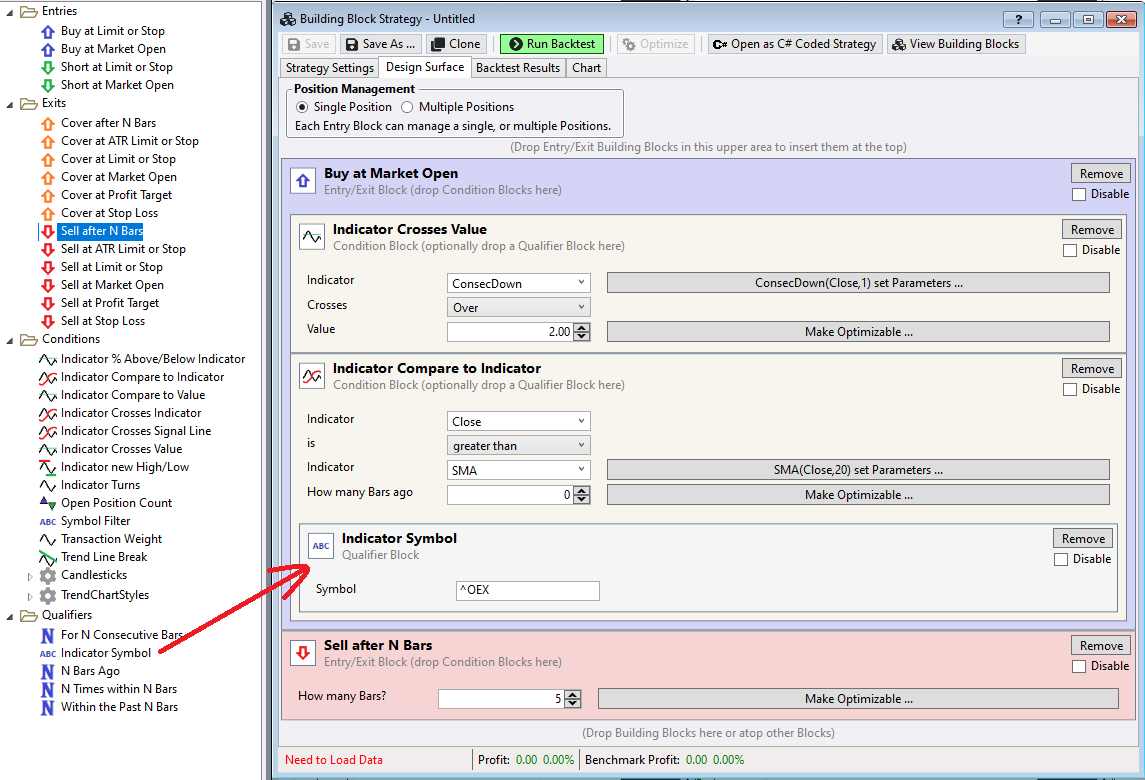
Unfortunately not. This compares the stock price (close) with the SMA of the OEX. I would like to have the OEX price (close) compared with SMA of the OEX and decide from there whether I would like to trade a specific stock.
QUOTE:
This compares the stock price (close) with the SMA of the OEX.
No, it compares the external symbol's price with the SMA of the external symbol. It's easy for you to prove it if you click "Open as C# coded strategy":
CODE:
externalSymbol = GetHistory(bars, "^OEX");
indicator1 = externalSymbol.Close;
indicator2 = new SMA(externalSymbol.Close,20);
...
if (index - 0 >= 0 && indicator1[index] > indicator2[index - 0])
Thanks for your explanation.
I would like to plot not just the OEX EMA but also the EMA itself.
Thus, I inserted into the code..
The code reads...
Unfortunately, that does not work.
I would like to plot not just the OEX EMA but also the EMA itself.
Thus, I inserted into the code..
QUOTE:
PlotIndicator(indicator1,Color.FromArgb(255,0,0,255));
The code reads...
CODE:

      externalSymbol = GetHistory(bars, "^OEX");
      indicator1 = externalSymbol.Close;
   PlotIndicator(indicator1,Color.FromArgb(255,0,0,255));
      indicator2 = new EMA(externalSymbol.Close,Parameters[0].AsInt);
      PlotIndicator(indicator2,Color.FromArgb(255,0,0,255));
Unfortunately, that does not work.
This should work:
CODE:
      externalSymbol = GetHistory(bars, "^OEX");
      indicator1 = externalSymbol.Close;
   PlotTimeSeries(indicator1, "^OEX", "external", Color.FromArgb(255, 0, 0, 255));
      indicator2 = new EMA(externalSymbol.Close,Parameters[0].AsInt);
   PlotIndicator(indicator2, Color.FromArgb(255, 0, 0, 255), null, false, "external");
Your Response
Post
Edit Post
Login is required