ZigZag has in it "Draw(Color upColor, Color downColor, LineStyle style, int width)". Therefore it has to know whether the drawn line is going up or down. I would like to set a variable whether the ZigZag line is increasing or decreasing. When applied to an indicator, I could use it as a filter for both back testing and for active trades (the dotted line). How can this be done?
Size:
Color:
Well, as says the
online guide there are two properties which discover the state of the ZigZag:
QUOTE:
bool peakDetected Returns true when a peak of the ZigZag reversal percentage has been detected. The value remains true until a new trough is detected.
bool troughDetected Returns true when a trough of the ZigZag reversal percentage has been detected. The value remains true until a new peak is detected.
Naturally, these properties belong to an instance of the ZZ object which on the current bar is:
CODE:
Please log in to see this code.
Size:
Color:
I tried using zzLast per the attachment and the peak and trough detections don't match up with the drawn lines. Am I missing something? Appreciate your help.
CODE:
Please log in to see this code.
Size:
Color:
Everything matches very well. What's confused you is the fact that the underlying functions
Peak and Trough introduce some natural lag necessary to avoid 20/20 hindsight.
Size:
Color:
I accept that; however, the lines are not drawn per the peak and trough detections. The coding for zig zag obviously uses something else. Do you know what it is?
Size:
Color:
It's documented in the online guide (per the link above). The coding is different and can be found in the open source code.
Size:
Color:
How does one get to the open source code?
Size:
Color:
The peaks and troughs in the example clearly match the StochK indicator they're applied to - as documented in the Wiki link I referred you to. Do you have a specific concern (if so what is it exactly) or did you expect that the example would apply to prices?
Size:
Color:
I need a variable to correspond with each of the lines drawn. For instance, from a peak to a trough I want the variable to be 0. For a trough to a peak, I want the variable to be 1. The variable would need to correspond with each of the lines. An example as how to use this is that if the line is rising (trough to peak), I can use the variable to take it as permission to buy. Using (zzLast.troughDetected) or (zzLast.peakhDetected) apparently does not work as shown from the script. The colors do not match up with the lines.
Size:
Color:
The colors do match up with the lines perfectly. But how you want them to match the peak/trough bar is possible
in an ideal world only. There will be a delay that you're seeing and which leads you to thinking that there's a mismatch (there is not). See the picture:
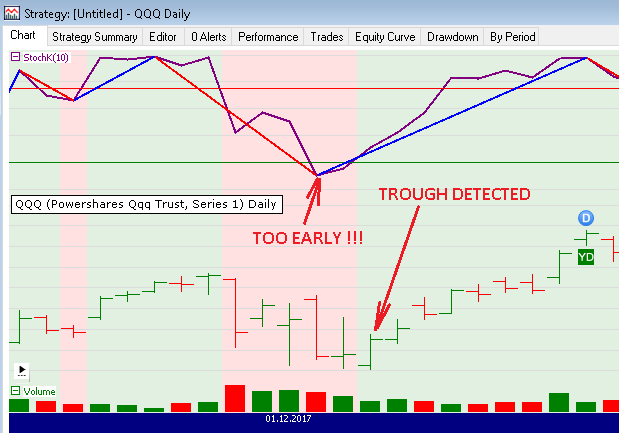
The color changes when the trough gets detected. Hope this is more clear now.
So I've got nothing more to add to post #2. The code already contains everything you need to reach your goal. Good luck!
Size:
Color:
Let's use the example you provided. It appears that the colors match up with the peaks and troughs of the price series. I would like the colors to match up with the peaks and troughs of the indicator. As far as trading goes, when the stochastic begins to go down (red line), it would signal that it might be a good time to get out of a long trade before it actually goes down. Again, I am looking for a variable to correspond to the peaks and troughs of the indicator, not the price.
Size:
Color:
QUOTE:
the colors match up with the peaks and troughs of the price series
This is by chance observation only (plus the fact that nearly all indicators lag price).
CODE:
Please log in to see this code.
You have it. The input to the ZZ indicator is the StochK, not price.
The indicator is detecting the peaks and troughs in the StochK on the bar where the color changes. You cannot detect a peak or trough on the bar that it actually occurs.
There must be movement in the opposite direction for a peak or trough to form.What are you trying to achieve?
Size:
Color:
Perhaps the stoch is not a good example since it corresponds to price too much. What I want to do is use a longer term indicator to determine whether the trend is up or down, for instance, the TSI. If the trend is up, it would provide a permission for other indicators to determine whether to take a trade or not. If the trend is down, it would prevent taking trades. Since there are ups and downs in the TSI indicator, like any other, I believe this method would show the overall trend since it moves slowly.
The zigzag shows a dotted line after the last peak or trough. Even though not perfect, it shows the trend direction of the indicator. With a variable assigned to the zigzag lines on the indicator, it would also allow back testing.
Size:
Color:
CODE:
Please log in to see this code.
Of course the $64,000 question here is which Reverse % to take for each market and how/when to adjust it for changing market volatility.
Size:
Color:
Assume low volatility. Long term indicators do not have large swinging peaks and troughs. The way I see it, one can use moving averages, which can be misleading due to false indications. The other way is to compare a signal[bar] to another signal[bar-1] or [bar-2], etc., which can also give false signals. At least the zigzag points in the right direction.
This could also be used to provide alerts for stocks in up trends.
Size:
Color:
I would like to have a zigzag indicator with a variable Reverse %. I would like to use the changing volatility as % Up and % Down indicator. If the volatility is 10%, the Reverse % would be f.ex. 2.5%, with 20% it would 5% (just one quarter of the vola).
Size:
Color:
Will I be able to get access to a variable which follows zigzag status of an indicator per my original question?
Size:
Color:
Size:
Color: