Evaluated several position sizers that are based on equity curve trend or sliding window of recent trades to detect drawdown and stop trading until the window of recent trades turn profitable. Shortlisted these to be most promising, but ran into the following roadblocks -
1) Trading the Equity Curve - designed to stop opening positions when equity curve crosses under 10-day SMA. I've configured Reduction in position size to 100% to stop completely. Issues-
a) How do i see the crossunder/crossover points of the SMA on the equity curve - can i draw it on the equity curve visualizer?
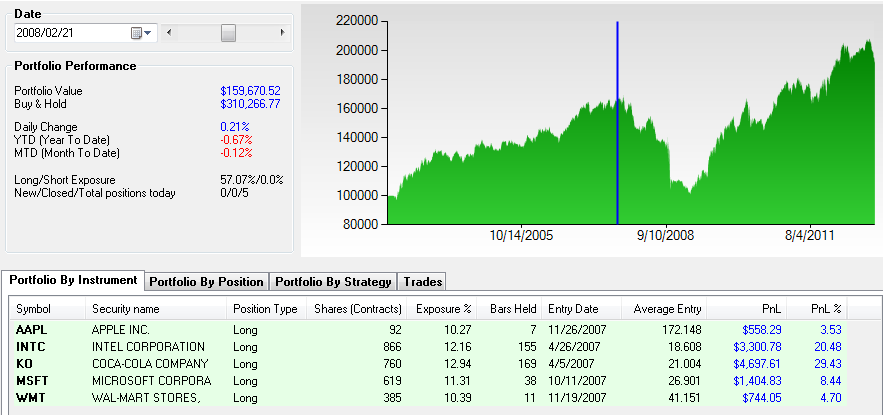
b) The Portfolio Inspector graphic (showing the equity curve dip) doesn't correspond to the trades and the date and equity size listed. Example, in attached graphic, the vertical marker shows Date of peak is 2/19/2010 and portfolio size is $95K .. but the equity curve axes shows date is 7/2008 and equity size is $150K. It gets worse, because when i add up the P&L of the positions that closed between 2/19-4/15/2010 (from the Trades tab), it shows a profit of $1.8K, yet the equity curve shows the worst drawdown of $50K. How do i correlate the Drawdown period to the closing trades during the Drawdown period? Need to do that to understand if the position sizer is working.
c) Recovery upon cross-over - with 100% reduction in position size upon 10-day SMA crossunder, i expected a small drawdown - however, the drawdown is nearly the same as without the position sizer. Also, it seems to add a few trades during the flat-lining, causing the equity curve to rise. How does it detect the cross-over - doesn't seem to simulate the equity curve-up with fictitious trades, as i compared it side-by-side with the original equity curve.
2) Other position sizers that seemed promising - Drawdown/Runup,Control Drawdown, Limit Monthly Drawdown - same question as (1c) for these - if i stop trading (100% reduction in position size), the documentation didn't suggest that these are smart enough to simulate the shadow equity curve and determine when to get back into the market?
-> Please address these/suggest work-arounds - needed to troubleshoot position sizing. (1b) seems like a bug.
I'm evaluating TSSF, which seems more promising, but will write a separate update on it based on what i find.
it stops trading and the equity flat-lines. Is the position sizer smart enough to simulate a shadow equity curve and determine the SMA-cross-over point, in order to start trading again? The documentation doesn't specify this scenario.
Size:
Color:
Screenshot for above post attached this time ..
Size:
Color:
QUOTE:
2) if i stop trading (100% reduction in position size), the documentation didn't suggest that these are smart enough to simulate the shadow equity curve and determine when to get back into the market?
No, neither of these or any other PosSizers will currently build the simulated "shadow" equity curve. And if Wealth-Lab stops making trades due to a 100% reduction, the equity flat-lines and backtested trades will stop. Consequently, you need to pick a different number to avoid a complete halt.
QUOTE:
b) The Portfolio Inspector graphic (showing the equity curve dip) doesn't correspond to the trades and the date and equity size listed.
Since the Inspector window isn't being scaled properly to the Strategy window as it does when DPI is set to Normal, this seems to be a new side effect of the not so new known issue:
Open Issues > (146) Aplication needs to support 120 DPI throughout - DeferredConsequently, the misalignment will be fixed by reverting to the standard DPI.
QUOTE:
a) How do i see the crossunder/crossover points of the SMA on the equity curve - can i draw it on the equity curve visualizer?
Sure you can, by creating an all new visualizer yourself by following the API manual:
Wealth-Lab Version 6 (.NET) Development Guide
Size:
Color:
For (1b),I am on the Standard Display size at 100% text size - this seems to be a different bug/issue in Portfolio Inspector.
My broader question is - how do i map the Drawdown period (in the Drawdown/Equity Curve graphics) to the trades that are causing the Drawdown? Since i can't get the exact dates of the drawdown/equity curve from the graphics, any other way to mapping the trades? Need to see if there's a pattern in the trades that helps explain the drawdown and if i can configure the pattern in the position sizer to avoid the drawdown.
thanks
Kiran
Size:
Color:
QUOTE:
For (1b),I am on the Standard Display size at 100% text size - this seems to be a different bug/issue in Portfolio Inspector.
The attached screenshot is indisputably taken at "Medium - 125%". On the Standard display, the Portfolio Inspector works correctly:
On a related note, looking at how focused on futures you are (which is very atypical of a Fidelity customer, whom they don't even offer futures trading), I recommend against including symbols that suddenly stop trading in your DataSet - like an expired futures contract. The Inspector might not correctly handle this. The backtest's last date of 7/29/2013 suggests me this might be the case.
QUOTE:
Since i can't get the exact dates of the drawdown/equity curve from the graphics, any other way to mapping the trades?
Two words: Portfolio Inspector. It's built exactly for this purpose, and generally works correctly on standard displays. No alternative ways needed.
Size:
Color:
Will check with my IT- my Control Panel->Display shows 100% (Standard). My futures data set only goes until 7/29, and i'm using Continuous Futures data, so no expiry - so, Port Insp should be ok with this data-set, correct? Thanks for the tip.
Question reg TSSF Position Sizer - I tried the TSSF which looks at a sliding window of last 20 trades and Win-Loss ratio and Win% to determine position size. I expected that unlike other PosSizers listed earlier in this post, this should recover from a complete "equity flat-line caused by a 0 position size during drawdown, because it refers to the last 20 trades that have already executed by the Strategy Engine, and doesn't rely on the equity curve to build up from accepted trades.
However, it doesn't recover from a flat-ilne - it forcibly changes my entry of 0% Minimum Size to a small non-zero size (0.1%), which isnt enough to recover the flat-line. Why was this sizer designed to rely on the accepted trades in Equity Curve and not the raw trades generated by the strategy - the original author of this sizer recommends using the raw trades -
http://championship.mql4.com/2008/news/366Any way i can get the TSSF pos sizer to use the raw trades from the strategy?
thanks
Kiran
Size:
Color:
QUOTE:
However, it doesn't recover from a flat-ilne
Already answered in my post #3 above.
QUOTE:
Any way i can get the TSSF pos sizer to use the raw trades from the strategy?
Build your own PosSizer that takes the trouble to use the raw trades. It would somewhat complicate the code.
Size:
Color:
Update: in a future release, I consider adding an option to TSSF to size positions using the raw trades.
Size:
Color:
Thanks, that will help catch the runups much earlier and the sizer will show better performance.
Pl also note that the TSSF article mentions 3 sizes - Unprofitable, Safe (very profitable) and middle-zone. The sizer configuration allows for Min and Max .. Is the Initial size meant to be the middle-zone? Pl allow for all 3 sizes when you add the enhancement.
Pl let me know (on this forum post?) when you release it.
thanks
Kiran
Size:
Color:
QUOTE:
Pl allow for all 3 sizes when you add the enhancement.
No other changes to TSSF are planned.
QUOTE:
Pl let me know (on this forum post?) when you release it.
Please feel free to monitor the extension's change log or enable "Check for Updates on Program Start" in the Extension Manager.
Size:
Color:
Heads-up: the option "Include raw trades (ghost trading)" discussed above was implemented in v2014.02 but it's not recommended to use it. Looks like there's a bug. The backtesting results may differ for a new backtest (e.g. when a Strategy opens or you re-run it with "Backtest on all symbols...") vs. when TSSF is applied to the same Strategy window from the Position Size dropdown box on-the-fly.
Turn it off until we fix it in a future release. Stay tuned for updates.
Size:
Color: