Size:
Color:
Look for it in the upcoming release 2015.12. Thank you for your suggestion.
Size:
Color:
Meanwhile you can record e-ratio in a DataSeries for plotting on a bar-by-bar basis. For example:
CODE:
Please log in to see this code.
Size:
Color:
Thank you very much for implementing it so quickly, Eugene.
Size:
Color:
Hi Eugene,
I'm very interesting on this concept two. I would like to know if it is possible to add also a new visualizer to see the e-Ratio like the last graph in the article ?
Size:
Color:
Hi Alexandre,
As new doesn't necessarily means better, e-ratio would not be a breakthrough tool for us. I've digged into it a bit deeper and can say that we already have an equally efficient metric, even set of metrics - Trade Efficiency. You can learn about it from
this article (PDF). My choice to include e-ratio was driven by the task's simplicity. To build the visualizer (which is a more complex task), I have to be sure that this would provide an edge against an already available instrument - the
Trade Life chart.
Size:
Color:
Thank you Eugene for all this information.I agree with you that Trade life and Trade efficiency are very good together.
At this time, I'm not using the Trade life chart because the chart is unreadable. Indeed, you see on the same chart all trades and there is no possibility to make a zoom to have a more readable scale. When you have a trading system with a lot of trade, it would be more efficient to see how is the trade life in average. Is it possible to add these possibilities ?
Size:
Color:
I wasn't sure that zoom would have any utility in this graph. To make the chart more readable please use a combination of opacity (to make it look more/less transparent) and filters by trade type, outcome and instrument.
Sorry, Average Trade Life is not planned for technical reasons.
Size:
Color:
Unfortunately, the transparent option doesn't give a help. Is it possible to add an option to export data from the trade life chart to Excel ? By this way, it would be easy for anyone to create the average trade life ?
Size:
Color:
Unfortunately, copy to clipboard isn't currently supported by the entire Trade Graphs for certain internal reason. So the workaround is to filter trades by trade type, outcome and instrument.
P.S. We may need to introduce an A-ratio: requests / posts * 100. Currently it's maxed out at all time high of 100: I can't make a single response without being presented with an automatic new feature request! :)
Size:
Color:
Thanks Eugene for your time !
PS : In France, we said that we haven't petrol but ideas ! I very love WLD. When you are a private trader like me, this is the only robust platform that you find to be able to trade on the french market like a pro. But if you want to have the best chances to win on the market, you need to be on the state of the art ;-)
Size:
Color:
Calculating e-ratio for the purposes of MS123 Scorecard and Performance+ is straightforward:
e-ratio = Sum of system's all MFE% / -(Sum of system's all MAE%)
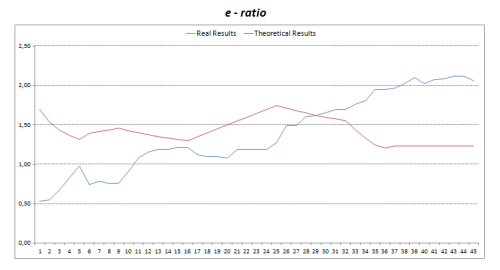
Alexandre's request is not that trivial and requires consideration. From what I understand he'd like to build the average e-ratio on a bar by bar basis. How do we deal with the fact that trades may have different duration? When building such e-ratio in the manner of the Trade Life chart, my proposition here is:
1. The average e-ratio line will have the duration of the longest position being held
2. For each bar "X", we note the e-ratio of each trade which has been held at least X bars
3. We sum these numbers into "E" and also sum the number of "participant" trades as "P" (for example, on bar = 50 there may be 10 trades being held for 50 bars, but for bar = 100 only 2 trades have had that duration).
4. On each bar, divide E by P to arrive at the rolling e-ratio. Division by zero is impossible by virtue of #1 (at least one trade with the longest duration always exists).
I'm afraid that the approach involving "participant" trades only would create inflated results. Consider this. Your system's made 100 trades. Typically, the trade duration is ~50 bars for 95 trades. The resulting e-ratio of 95% trades oscillates around 2.0 from bar 0 to bar 50.
But there are 5% trades which bring outlier profits from riding long trends (200 bars). Each one has an e-ratio of about 100.0 and causes a spike in the average ratio towards the right side of the chart (i.e. around bar #200): 100 / 5 = 20. We can avoid the spike by averaging the e-ratio across the total number of trades i.e. 100 / 100 = 1.0 (vs. 20). Which concept is correct?
Thoughts?
Size:
Color:
Size:
Color:
Thanks Alexandre, I've already read all that and more (the PDF was a good read). I'm not going in that direction. I rejected the idea of time frame in the first place (due to added complexity) and also rejected the use of ATR for normalization across markets (simple percentage would be sufficient).
Size:
Color:
Eugene,
What leads you to believe that a percentage approach is sufficient rather than using an ATR normalization?
Vince
Size:
Color:
Simplicity. Universality. Industry standard. Less one parameter variable i.e. ATR period (but less joy of curve fitting).
Size:
Color:
But have you done a real side-by-side comparison? My quick and crude experiments did show a (significant) difference.
Vince
Size:
Color:
Vince, do you have any opinion on question in post #12?
Size:
Color:
In my original idea, the average e-ratio has to be calculate like this :
- for each trade, calculate bar by bar the rolling e-ratio
- for each rolling e-ratio, calculate the average rolling e-ratio bar by bar
Like this, I'm thinking that you can define if your entry/exit signal can be improve. For example, if you see that the rolling e-ratio is under 1 in average during the 5 first bars on a trade, you can delay your entry condition by 5 bars .
Are you agree with this approach ?
Size:
Color:
I already noted in reply #14 that I rejected the idea of time (i.e. rolling metric) due to added complexity. My adaptive (parameterless) approach as proposed in post #12 is:
- For each trade, calculate the e-ratio bar by bar
- Determine the maximum trade duration (D)
- Average the e-ratio on each bar from 0 to (D)
What's wrong with this?
QUOTE:
But there are 5% trades which bring outlier profits from riding long trends (200 bars). Each one has an e-ratio of about 100.0 and cause a spike in the average ratio towards the right side of the chart (i.e. around bar #200): 100 / 5 = 20. We can avoid the spike by averaging the e-ratio across the total number of trades i.e. 100 / 100 = 1.0 (vs. 20). Which concept is correct?
I don't feel comfortable averaging across the total trades. I think there may be a flexible solution to this problem (parameterless again). For each trade duration, we could calculate the weight % of all 'participant' trades and adjust the e-ratio accordingly. Illustrating on example in post #12:
1. 95 trades out of 100 have lasted for 50 bars. Multiply the resulting e-ratio of 2.0 by 0.95 (weight = 95 / 100).
2. For those 5% 'outlier' which lasted 200 bars and caused an e-ratio spike to 100.0, adjust the e-ratio by 0.05 (=5 / 100) i.e. 100 * 0.05 = 5.0.
How about this approach?
Size:
Color:
Hi Eugene!
QUOTE:
Vince, do you have any opinion on question in post #12?
Here are my thoughts:
QUOTE:
Calculating e-ratio for the purposes of MS123 Scorecard and Performance+ is straightforward:
e-ratio = Sum of system's all MFE% / -(Sum of system's all MAE%)
This thought was what I used when I ran my "quick and dirty" experiment. (I used a trend-following system that I have been developing for my testing). I used the Dow 30, and that worked rather well, but it appeared to be dominated by AAPL's performance. I then removed AAPL from the list and the results were decidedly different, which was the reason for my comment in a previous post. It seems that if all of the trading vehicles have similar volatilities that your suggested approach works fine. But that is not the world I seem to trade.
I then ran the same system on the Dow 30 (and corrected for volatility using ATR as originally suggested) and found that the results with and without AAPL were very similar. I suggest you try it with one of your TF systems and see if you agree.
It appears that doing a full-blown e-ratio calculation with step-wise durations is well beyond the scope of the Scorecard since I believe that it would take hours for a system like mine - not practical.
Vince
Size:
Color:
QUOTE:
It appears that doing a full-blown e-ratio calculation with step-wise durations is well beyond the scope of the Scorecard
Thanks for your feedback Vince. Please note that since ATR has an input parameter it's impractical to utilize in Scorecards from a technical standpoint. A fixed parameter would not suffice. This is why I won't use ATR for e-ratio.
Size:
Color:
QUOTE:
A fixed parameter would not suffice.
Why not? Using a 14 period ATR is reasonably standard.
Vince
Size:
Color:
Because percentage is universal and parameterless and there always be someone who uses ATR(7) or ATR(200).
Size:
Color:
Eugene,
I'm not comfortable with your approach. I'm not understanding why you want to add a weight to average the e-ratio. I think you will complicate the interpretation of the result. For me, the e-ratio must help a trader to define a more interesting point to entry and to exit a trade position. For this reason, we must have the "real e-ratio" value.
Size:
Color:
QUOTE:
I'm not understanding why you want to add a weight to average the e-ratio.
Because you can't just take "
the time frame as the longest trade" as per your post #13. This leads to a problem of inflated numbers that posts #12 and #20 have brought to light. [Unless I'm mistaken, perhaps this is why the need in step-wise durations (re: post #21 by Vince)? It would be rather complex for this task.]
Okay, I've experimented with the rolling e-ratio visualizer and can say that I don't really like its current output either, adjusted or unadjusted. The visualizer is back to the drawing board. E-ratio will only be added to Performance+ and Scorecards in v.2015.12 as said previously.
Size:
Color:
Ruediger,
MS123 Visualizers 2015.12 has been released. Look for E-Ratio under Performance+ and MS123 Scorecards.
Size:
Color:
Here's an output from the rolling e-ratio visualizer based on algorithm from post #12.
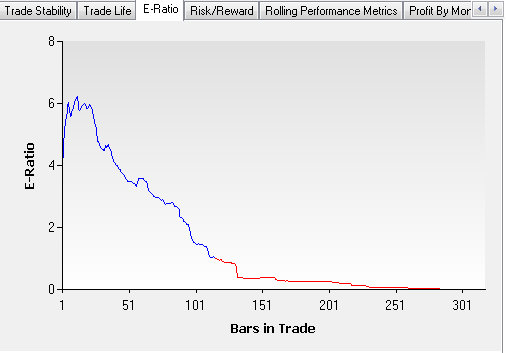
To reiterate:
1. On each bar X (where X varies from 0 to the longest trade duration):
a) Sum up the rolling e-ratio of trades which were held for X bars or longer
b) Increment the number of trades held for X+ bars
c) Determine weight (a.k.a. percentage of trades held for X+ bars) by dividing 1b by the total trade count (T)
2. Divide 1a (the sum of e-ratios) by T
3. Adjust the rolling e-ratio by multiplying it by 1c
In fact this is a simple moving average. Is there another way to achieve this without closing the trades (i.e. step-wise which I won't do anyway)?
Size:
Color:
Any feedback or ideas are welcome.
Size:
Color:
Any guidelines on what is a "good" value for the e-ratio vs a "don't trade this" value
Size:
Color:
See posts #1 and #13 for links.
Size:
Color:
Hi Eugene,
Even if the formula applied is different than I imagined, the result is interesting to help to optimize a trading strategy. I think you use the same type of tab as the Trade Life. So I guess there is no possible zoom or export data in Excel. It is the regret that I have.
Size:
Color:
When reviewing the e-ratio visualizer I've decided that the approach I proposed (adding a weight) is penalizing big profitable trades that last for a long time. Back to the drawing board.
Size:
Color:
Are you going to add this new visualizer ? I'm still interesting on it.
Size:
Color:
No, unless one day it functions as expected. It's not ready. I seem to have hit a brick wall.
Size:
Color:
Hi Eugene,
If you are open to study again an E-Ratio visualizer, you can find the implemented logic in Build ALPHA software :
https://www.buildalpha.com/eratio/. As you can understand, I'm still interested ;-)
Size:
Color:
Hi Alexandre,
The logic in your link isn't much different from my implementation (2015 or 2016) except 1) normalization by ATR and 2) omission of what happens when all trades have a different BarsHeld value. But #2 isn't a problem, you just average over the numbers you have. As for #1, I've decided to stick with 14-bar ATR (hardcoded).
What the cherry-picked example in the link above does not account for is a trade that goes straight north (or south) i.e. a profitable trade with virtually no adverse excursion (or vice versa). Just a handful of such trades with a 3-digit E-Ratio would offset the otherwise reasonable average value. But at least I hope that the shape of the E-Ratio curve iself should be illustrative in such case.
The calculation I use is from my post #20. Look forward to the new visualizer in v2019.07 (end of June).
Size:
Color:
Thank you very much Eugene.
Size:
Color:
You're welcome. A couple of notes:
1. I decided not to complicate the visualizer's code with the logic from post #28
2. Still not convinced that the normalization by ATR is any superior to simply using the percentage value of MFE/MAE. This may be reverted in a future build if somebody notices a slowdown in Trade Graphs' performance in general. %MFE(MAE) should be faster and consume a bit less memory.
Size:
Color:
I think the idea of the ATR is to reduce the market noise when there is a high volatility.
Size:
Color:
@abegy
Alexandre, E-Ratio tab is now part of MS123 Visualizers v2019.07. Looking forward to your feedback.
Size:
Color:
Really nice ! This is a very good idea to add the number of trades.
Thanks a lot
Size:
Color:
Glad to help you.
Size:
Color: